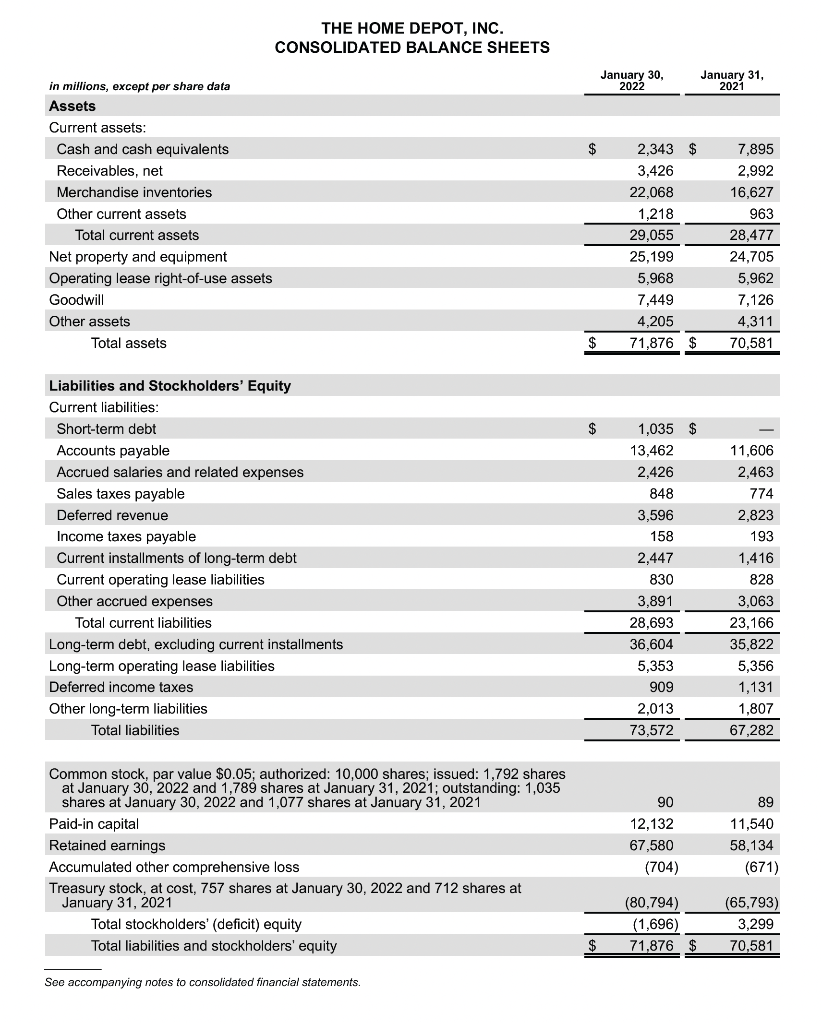
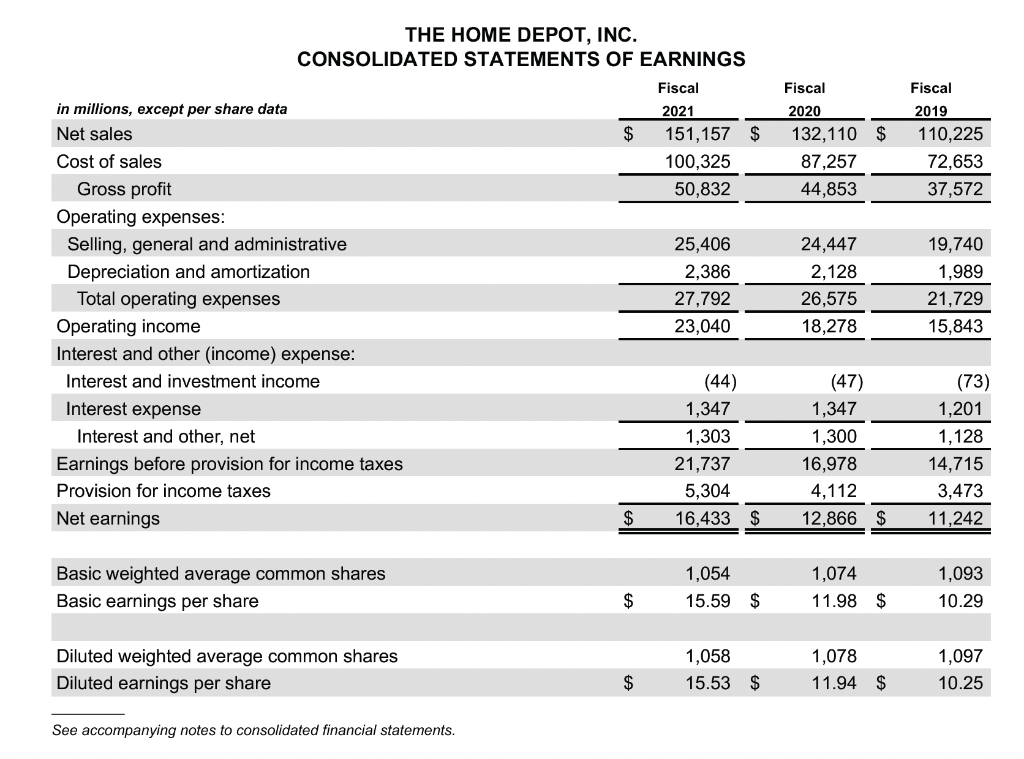
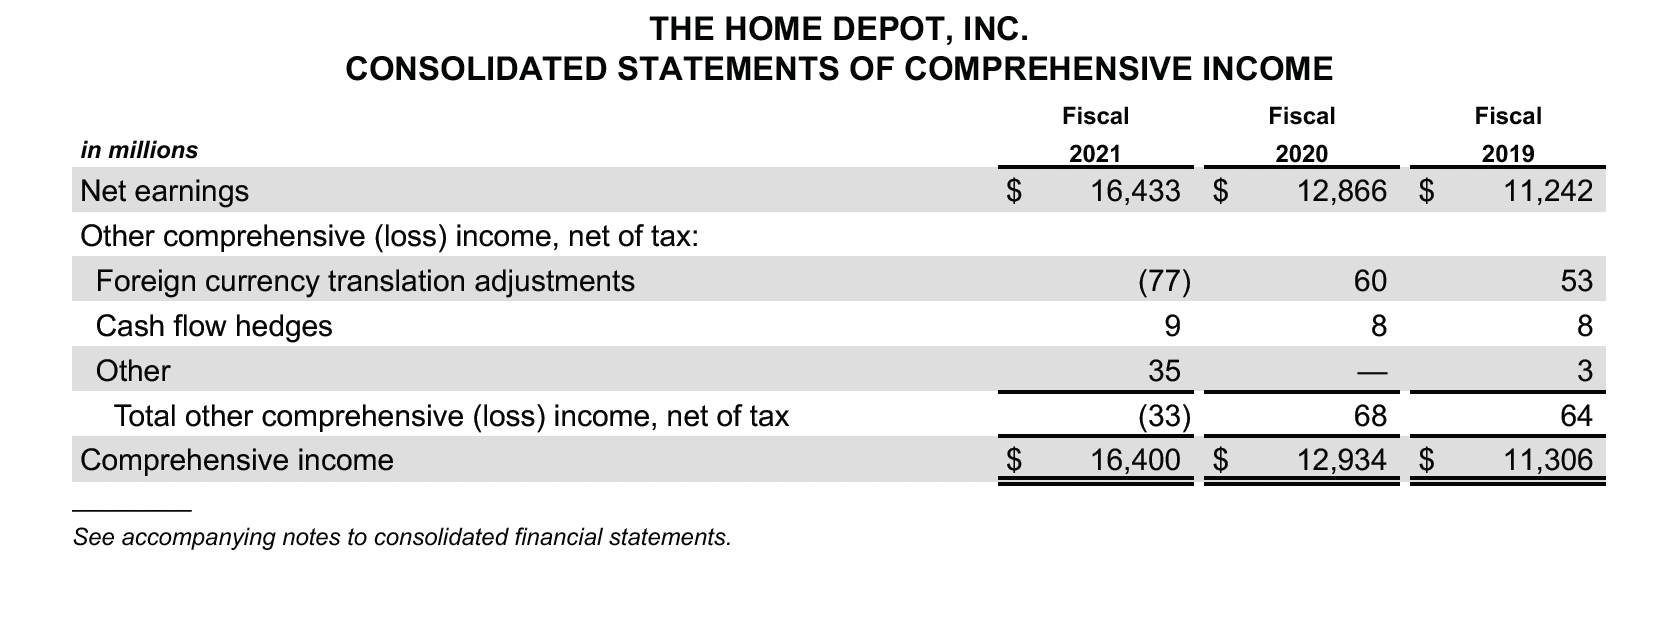
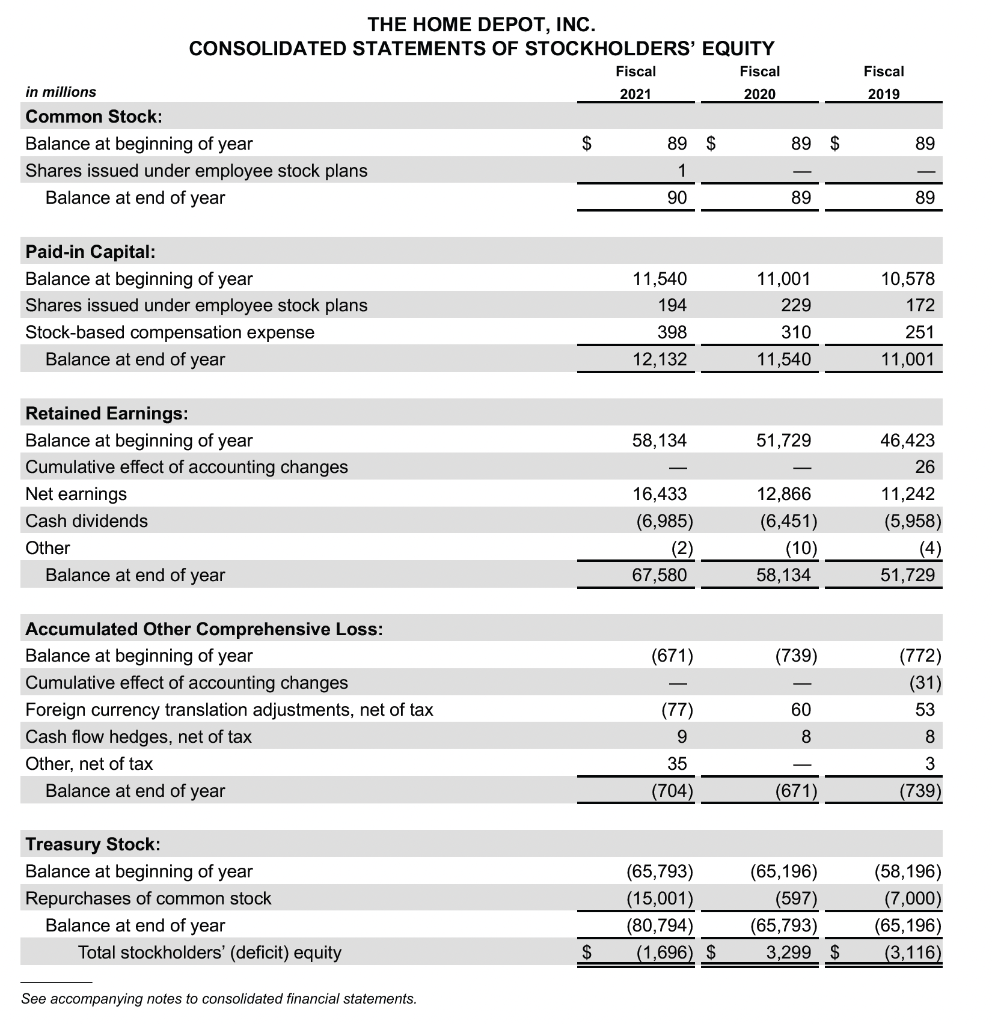
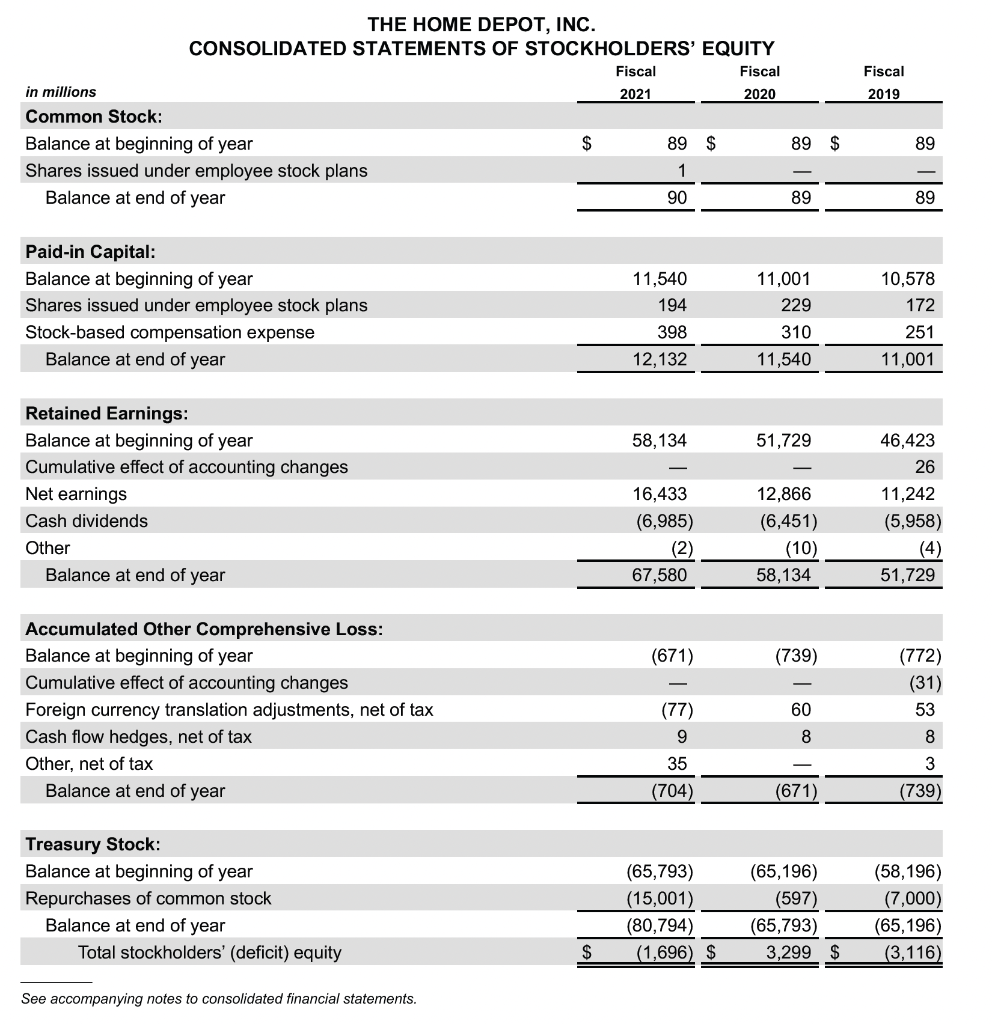
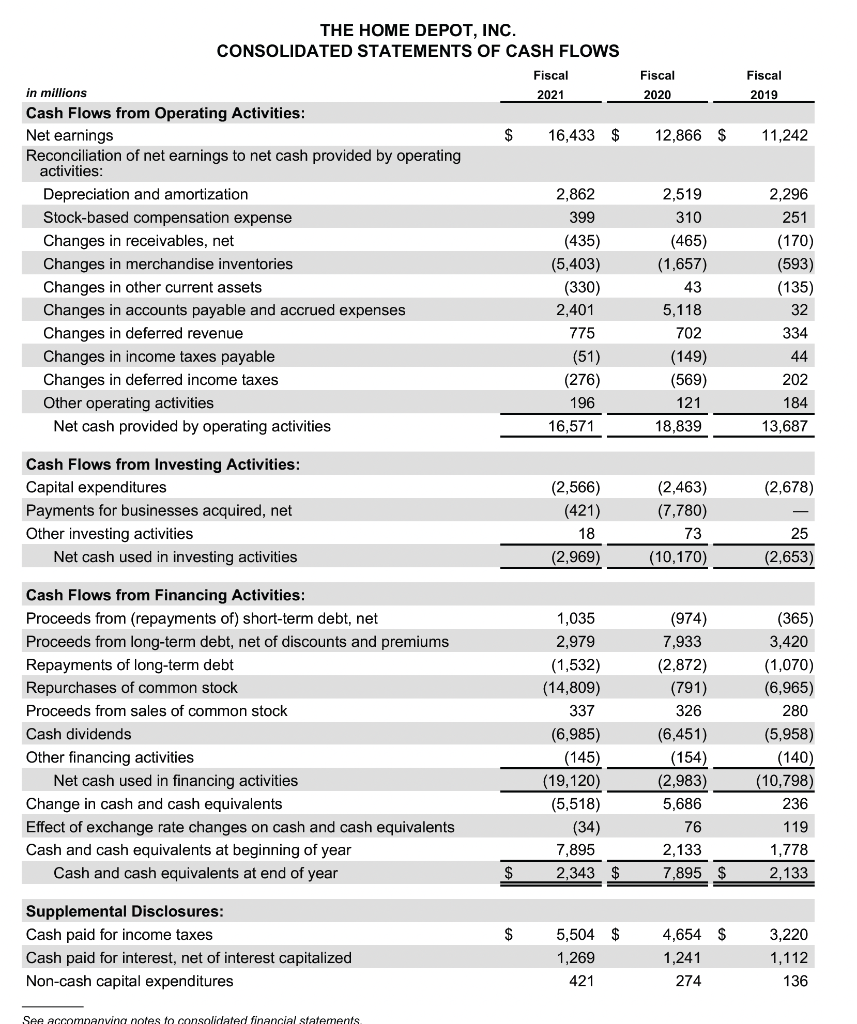


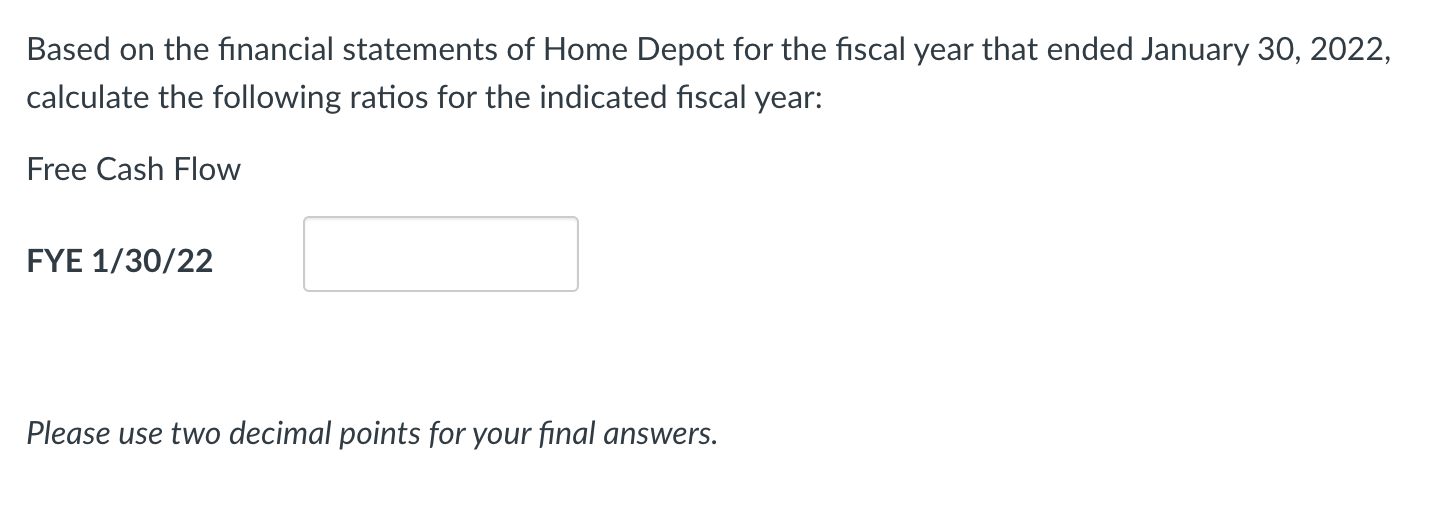
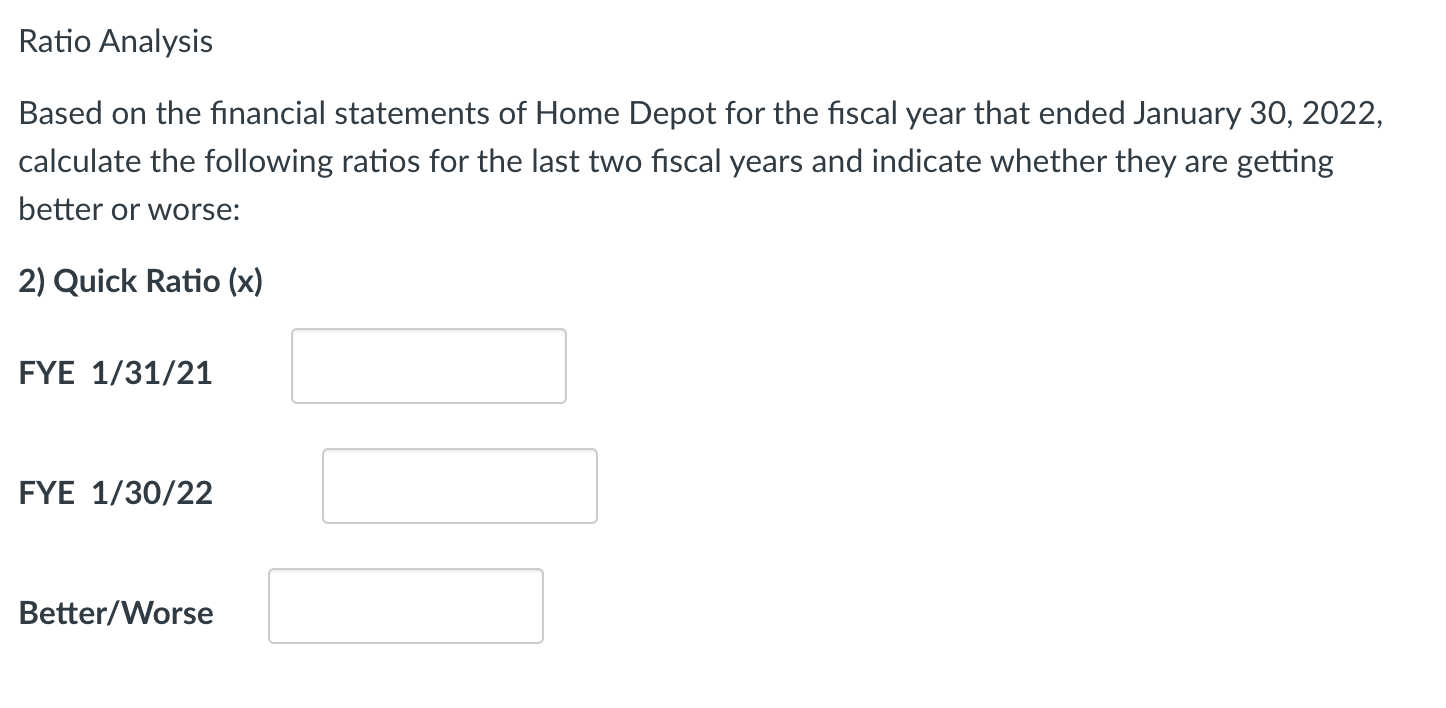
THE HOME DEPOT, INC. THE HOME DEPOT, INC. CONSOLIDATED STATEMENTS OF EARNINGS Basic weighted average common shares Basic earnings per share 1,05415.59$1,07411.981,093$10.29 Diluted weighted average common shares Diluted earnings per share 1,05815.53$1,07811.941,097$10.25 See accompanying notes to consolidated financial statements. THE HOME DEPOT, INC. CONSOLIDATED STATEMENTS OF COMPREHENSIVE INCOME THE HOME DEPOT, INC. CONSOLIDATED STATEMENTS OF STOCKHOLDERS' EQUITY Paid-in Capital: Balance at beginning of year Shares issued under employee stock plans Stock-based compensation expense Balance at end of year \begin{tabular}{rrr} 194 & 229 & 172 \\ 3998 & 310 \\ \hline 12,132 \\ \hline \end{tabular} Retained Earnings: Balance at beginning of year Cumulative effect of accounting changes Net earnings Cash dividends Other Balance at end of year \begin{tabular}{rrr} (2) & (10) & (4) \\ \hline 67,580 \\ \hline \end{tabular} Accumulated Other Comprehensive Loss: Balance at beginning of year Cumulative effect of accounting changes Foreign currency translation adjustments, net of tax Cash flow hedges, net of tax Other, net of tax Balance at end of year (704)35(671)3(739) Treasury Stock: Balance at beginning of year See accompanying notes to consolidated financial statements. THE HOME DEPOT, INC. CONSOLIDATED STATEMENTS OF STOCKHOLDERS' EQUITY Paid-in Capital: Balance at beginning of year Shares issued under employee stock plans Stock-based compensation expense Balance at end of year \begin{tabular}{rrr} 194 & 229 & 172 \\ 3998 & 310 \\ \hline 12,132 \\ \hline \end{tabular} Retained Earnings: Balance at beginning of year Cumulative effect of accounting changes Net earnings Cash dividends Other Balance at end of year \begin{tabular}{rrr} (2) & (10) & (4) \\ \hline 67,580 \\ \hline \end{tabular} Accumulated Other Comprehensive Loss: Balance at beginning of year Cumulative effect of accounting changes Foreign currency translation adjustments, net of tax Cash flow hedges, net of tax Other, net of tax Balance at end of year (704)35(671)3(739) Treasury Stock: Balance at beginning of year See accompanying notes to consolidated financial statements. THE HOME DEPOT. INC. Receivables The followina tahle nresents c.nmnonents of receivahles net' Receivables The followina tahle nresents c.nmnonents of receivahles net' Based on the financial statements of Home Depot for the fiscal year that ended January 30, 2022, calculate the following ratios for the last two fiscal years: Net Working Capital FYE 1/31/21 FYE 1/30/22 Based on the financial statements of Home Depot for the fiscal year that ended January 30, 2022, calculate the following ratios for the indicated fiscal year: Free Cash Flow FYE 1/30/22 Please use two decimal points for your final answers. Based on the financial statements of Home Depot for the fiscal year that ended January 30, 2022, calculate the following ratios for the last two fiscal years and indicate whether they are getting better or worse: 2) Quick Ratio (x) FYE 1/31/21 FYE 1/30/22 Better/Worse Based on the financial statements of Home Depot for the fiscal year that January 30, 2022, calculate the following ratios for the last two fiscal years and indicate whether they are getting better or worse: 3) Inventory Turnover(x) FYE 1/31/21 FYE 1/30/22 Better/Worse Please use two decimal points for your final answers. Based on the financial statements of Home Depot for the fiscal year that ended January 30, 2022, calculate the following ratios for the last two fiscal years and indicate whether they are getting better or worse: 4) Days Sales Outstanding (Days) FYE 1/31/21 FYE 1/30/22 Better/Worse For this question, please use three decimal points for your final answers. Based on the financial statements of Home Depot for the fiscal year that ended January 30, 2022, calculate the following ratios for the last two fiscal years and indicate whether they are getting better or worse: 4) Days Sales Outstanding (Days) FYE 1/31/21 FYE 1/30/22 Better/Worse For this question, please use three decimal points for your final answers. Ratio Analysis Based on the financial statements of Home Depot for the fiscal year that ended January 30, 2022, calculate the following ratios for the last two fiscal years and indicate whether they are getting better or worse: 5) Fixed Asset Turnover (x) FYE 1/31/21 FYE 1/30/22 Better/Worse Please use two decimal points for your final answers. Based on the financial statements of Home Depot for the fiscal year that ended January 30, 2022, calculate the following ratios for the last two fiscal years and indicate whether they are getting better or worse: 6) Total Asset Turnover (x) FYE 1/31/21 FYE 1/30/22 Better/Worse Please use two decimal points for your final answers. Based on the financial statements of Home Depot for the fiscal year that ended January 30, 2022, calculate the following ratios for the last two fiscal years and indicate whether they are getting better or worse: 8) Times Interest Earned (x) FYE 1/31/21 FYE 1/30/22 Better/Worse Please use two decimal points for your final answers. Based on the financial statements of Home Depot for the fiscal year that ended January 30, 2022, calculate the following ratios for the last two fiscal years and indicate whether they are getting better or worse: 8) Times Interest Earned (x) FYE 1/31/21 FYE 1/30/22 Better/Worse Please use two decimal points for your final answers. Based on the financial statements of Home Depot for the fiscal year that ended January 30, 2022, calculate the following ratios for the last two fiscal years and indicate whether they are getting better or worse: 9) Operating Profit Margin (\%) FYE 1/31/21 % FYE 1/30/22 % Better/Worse Please use two decimal points for your final answers. Based on the financial statements of Home Depot for the fiscal year that ended January 30, 2022, calculate the following ratios for the last two fiscal years and indicate whether they are getting better or worse: 10) Net Profit Margin (\%) FYE 1/31/21 % FYE 1/30/22 % Better/Worse Please use two decimal points for your final answers


