Answered step by step
Verified Expert Solution
Question
1 Approved Answer
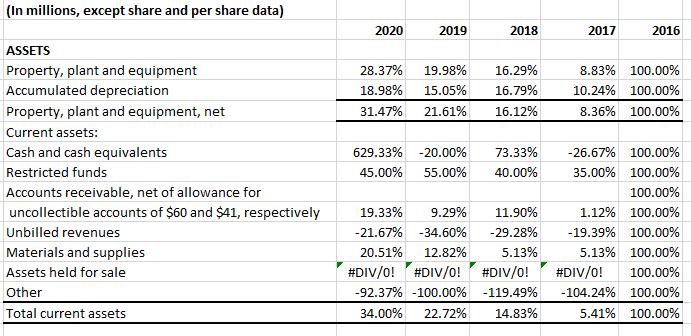
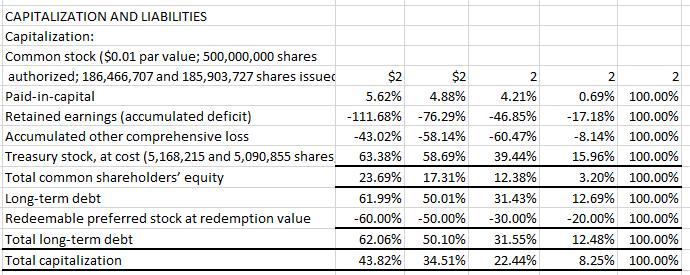
The horizontal analysis calculations have been carried out. 2016 was used as the base year. Assist in interpreting the significant trend from the information provided
The horizontal analysis calculations have been carried out. 2016 was used as the base year. Assist in interpreting the significant trend from the information provided below:


(In millions, except share and per share data) ASSETS Property, plant and equipment Accumulated depreciation Property, plant and equipment, net Current assets: Cash and cash equivalents Restricted funds Accounts receivable, net of allowance for uncollectible accounts of $60 and $41, respectively Unbilled revenues Materials and supplies Assets held for sale Other Total current assets 2020 2019 2018 28.37% 19.98% 16.29% 18.98% 15.05% 16.79% 31.47% 21.61% 16.12% 629.33% -20.00% 45.00% 55.00% 73.33% 40.00% 19.33% 9.29% -21.67% -34.60% 20.51% 12.82% #DIV/0! #DIV/0! #DIV/0! -92.37% -100.00 % -119.49% 34.00% 22.72% 14.83% 11.90% -29.28% 5.13% 2017 2016 8.83% 100.00% 10.24% 100.00% 8.36% 100.00% -26.67% 100.00% 35.00% 100.00% 100.00% 1.12% 100.00% -19.39% 100.00% 5.13% 100.00% #DIV/0! 100.00% -104.24% 100.00% 5.41% 100.00%
Step by Step Solution
★★★★★
3.42 Rating (146 Votes )
There are 3 Steps involved in it
Step: 1
From the horizontal analysis provided we can see various trends in the assets liabilities and equity ...
Get Instant Access to Expert-Tailored Solutions
See step-by-step solutions with expert insights and AI powered tools for academic success
Step: 2

Step: 3

Ace Your Homework with AI
Get the answers you need in no time with our AI-driven, step-by-step assistance
Get Started


