Answered step by step
Verified Expert Solution
Question
1 Approved Answer
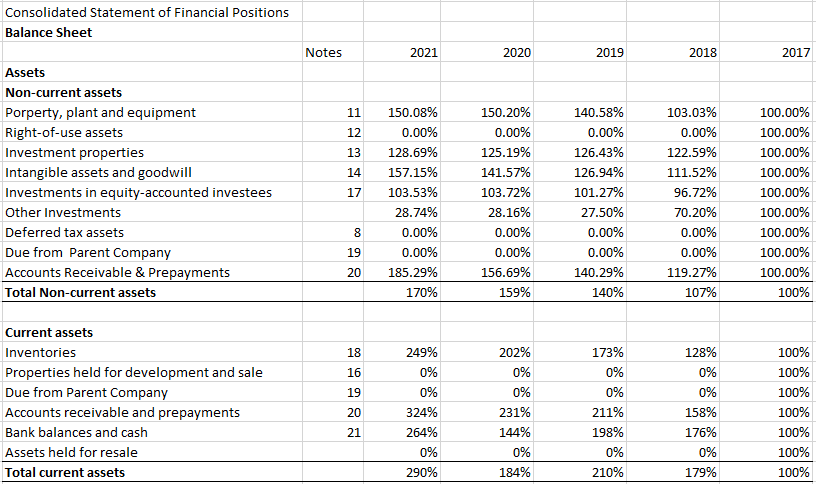
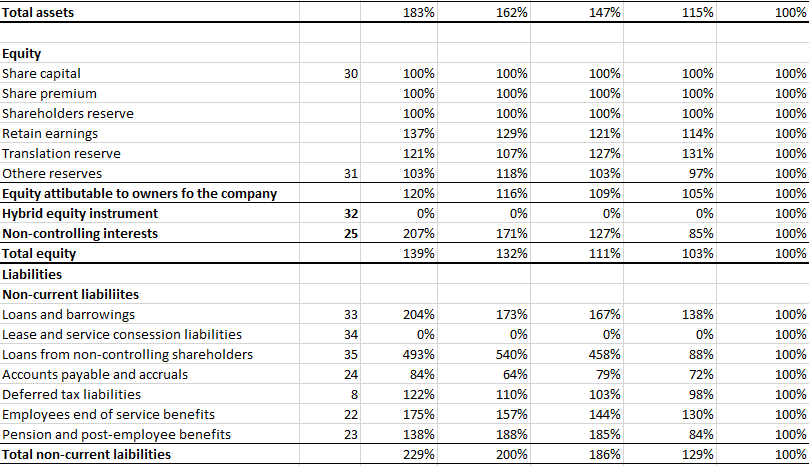
The horizontal analysis calculations have been carried out. Assist in interpreting the trend from 2017 to 2021 from the information provided below: What is missing?
The horizontal analysis calculations have been carried out. Assist in interpreting the trend from 2017 to 2021 from the information provided below:


What is missing? interpret the horizontal trend data for the 5years of data given.
Consolidated Statement of Financial Positions Balance Sheet \begin{tabular}{|l|l|l|l|l|l|} \hline Notes & 2021 & 2020 & 2019 & 2018 & 2017 \\ \hline \end{tabular} Assets Non-current assets Current assets Inventories Properties held for development and sale Due from Parent Company Accounts receivable and prepayments Bank balances and cash Assets held for resale Total current assets \begin{tabular}{|r|r|r|r|r|r|} \hline 18 & 249% & 202% & 173% & 128% & 100% \\ \hline 16 & 0% & 0% & 0% & 0% & 100% \\ \hline 19 & 0% & 0% & 0% & 0% & 100% \\ \hline 20 & 324% & 231% & 211% & 158% & 100% \\ \hline 21 & 264% & 144% & 198% & 176% & 100% \\ \hline & 0% & 0% & 0% & 0% & 100% \\ \hline & 290% & 184% & 210% & 179% & 100% \\ \hline \end{tabular} Total assets 183% 162% 147% 115% 100% Equity Share capital Share premium Shareholders reserve Retain earnings Translation reserve Othere reserves Equity attibutable to owners fo the company Hybrid equity instrument Non-controlling interests Total equity \begin{tabular}{|r|r|r|r|r|r|} \hline 30 & 100% & 100% & 100% & 100% & 100% \\ \hline & 100% & 100% & 100% & 100% & 100% \\ \hline 100% & 100% & 100% & 100% & 100% \\ \hline 137% & 129% & 121% & 114% & 100% \\ \hline 121% & 107% & 127% & 131% & 100% \\ \hline 31 & 103% & 118% & 103% & 97% & 100% \\ \hline & 120% & 116% & 109% & 105% & 100% \\ \hline 32 & 0% & 0% & 0% & 0% & 100% \\ \hline 25 & 207% & 171% & 127% & 85% & 100% \\ \hline & 139% & 132% & 111% & 103% & 100% \\ \hline \end{tabular} Liabilities Non-current liabiliites Loans and barrowings Lease and service consession liabilities Loans from non-controlling shareholders Accounts payable and accruals Deferred tax liabilities Employees end of service benefits Pension and post-employee benefits Total non-current laibilities \begin{tabular}{|r|r|r|r|r|r|} \hline 33 & 204% & 173% & 167% & 138% & 100% \\ \hline 34 & 0% & 0% & 0% & 0% & 100% \\ \hline 35 & 493% & 540% & 458% & 88% & 100% \\ \hline 24 & 84% & 64% & 79% & 72% & 100% \\ \hline 8 & 122% & 110% & 103% & 98% & 100% \\ \hline 22 & 175% & 157% & 144% & 130% & 100% \\ \hline 23 & 138% & 188% & 185% & 84% & 100% \\ \hline & 229% & 200% & 186% & 129% & 100% \\ \hline \end{tabular}Step by Step Solution
There are 3 Steps involved in it
Step: 1

Get Instant Access to Expert-Tailored Solutions
See step-by-step solutions with expert insights and AI powered tools for academic success
Step: 2

Step: 3

Ace Your Homework with AI
Get the answers you need in no time with our AI-driven, step-by-step assistance
Get Started


