

Question
The HR head of firm ABC needs to forecast the personnel costs spent on bonus in two years of time. The bonus distribution depends on
The HR head of firm ABC needs to forecast the personnel costs spent on bonus in two years of time. The bonus distribution depends on the overall evaluation of each employees performance in the entire year before the bonus payment. The forecast of the performance for next year is therefore essential in this bonus calculation. Beside the owner and the HR head, there are 5 regular employees currently working in ABC.
Each employee is assessed quarterly in the following four categories:
(a) Efficiency
(b) Communication
(c) Teamwork
(d) Productivity
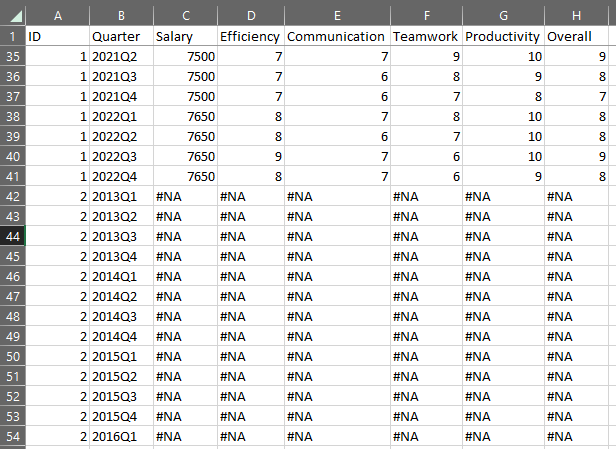
The performance under each category is rated on a 10-point scale, where 1 = absolutely dissatisfied, and 10 = absolutely satisfied. The HR department also needs to aggregate the evaluations of each employee in the 4 categories as his/her overall performance in that quarter for the bonus calculation. The quarterly ratings in every category of each employee are stored as individual records in the dataset employee_performance.csv. Here, the column labels correspond to the category names. Beside the ratings and the time indicator, the employee ID as well as their salaries in the corresponding quarter are also saved in two other columns. Naturally, since not every employee has been working in this enterprise for the entire time range, there are missing data for the periods when the employees were not employed by ABC.
The annual performance of each employee is calculated by averaging his/her quarterly median rating. The bonus amount for the employee in the corresponding year is paid according to the following distribution:
Average score >8 and 10: 3-Month Salary
Average score >5 and 8: 2-Month Salary
Average score >2 and 5: 1-Month Salary
Average score: 2: No bonus
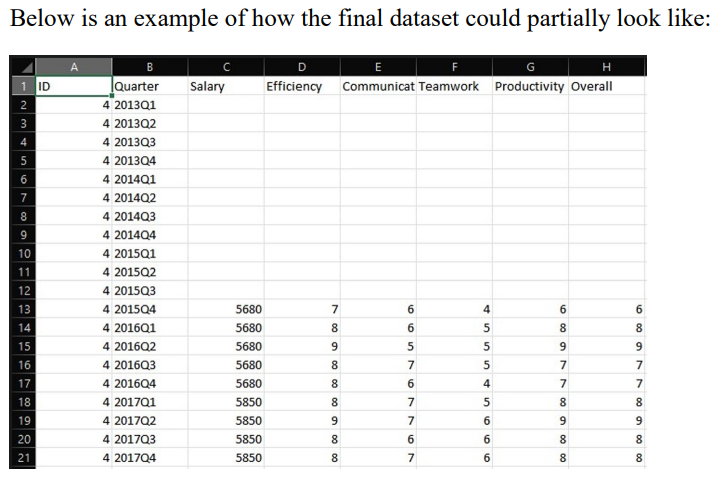
In the following, prepare a dataset in 10 steps or less so that time series forecasting of the overall performance for each employee in the next 4 quarters can be carried out.
For your report, follow the following three instructions: (i) Breakdown your data preparation steps into clear and logical steps.
The following Screenshot is an extract of the excel file.
Here is an example: Step 1: Aggregate variables a, b, and c using the function f. Step 2: Copy and paste the column xxx at the end of the spreadsheet, etc.
Step by Step Solution
There are 3 Steps involved in it
Step: 1

Get Instant Access to Expert-Tailored Solutions
See step-by-step solutions with expert insights and AI powered tools for academic success
Step: 2

Step: 3
Ace Your Homework with AI
Get the answers you need in no time with our AI-driven, step-by-step assistance
Get Started
Audit Criteria For Electronic Document Management Processes And Associated IT Solutions
Authors: Alexander D Balzer, Dr Klaus-Peter Elpel, Volker Feist
5th Edition
3932898281, 978-3932898280