Answered step by step
Verified Expert Solution
Question
1 Approved Answer
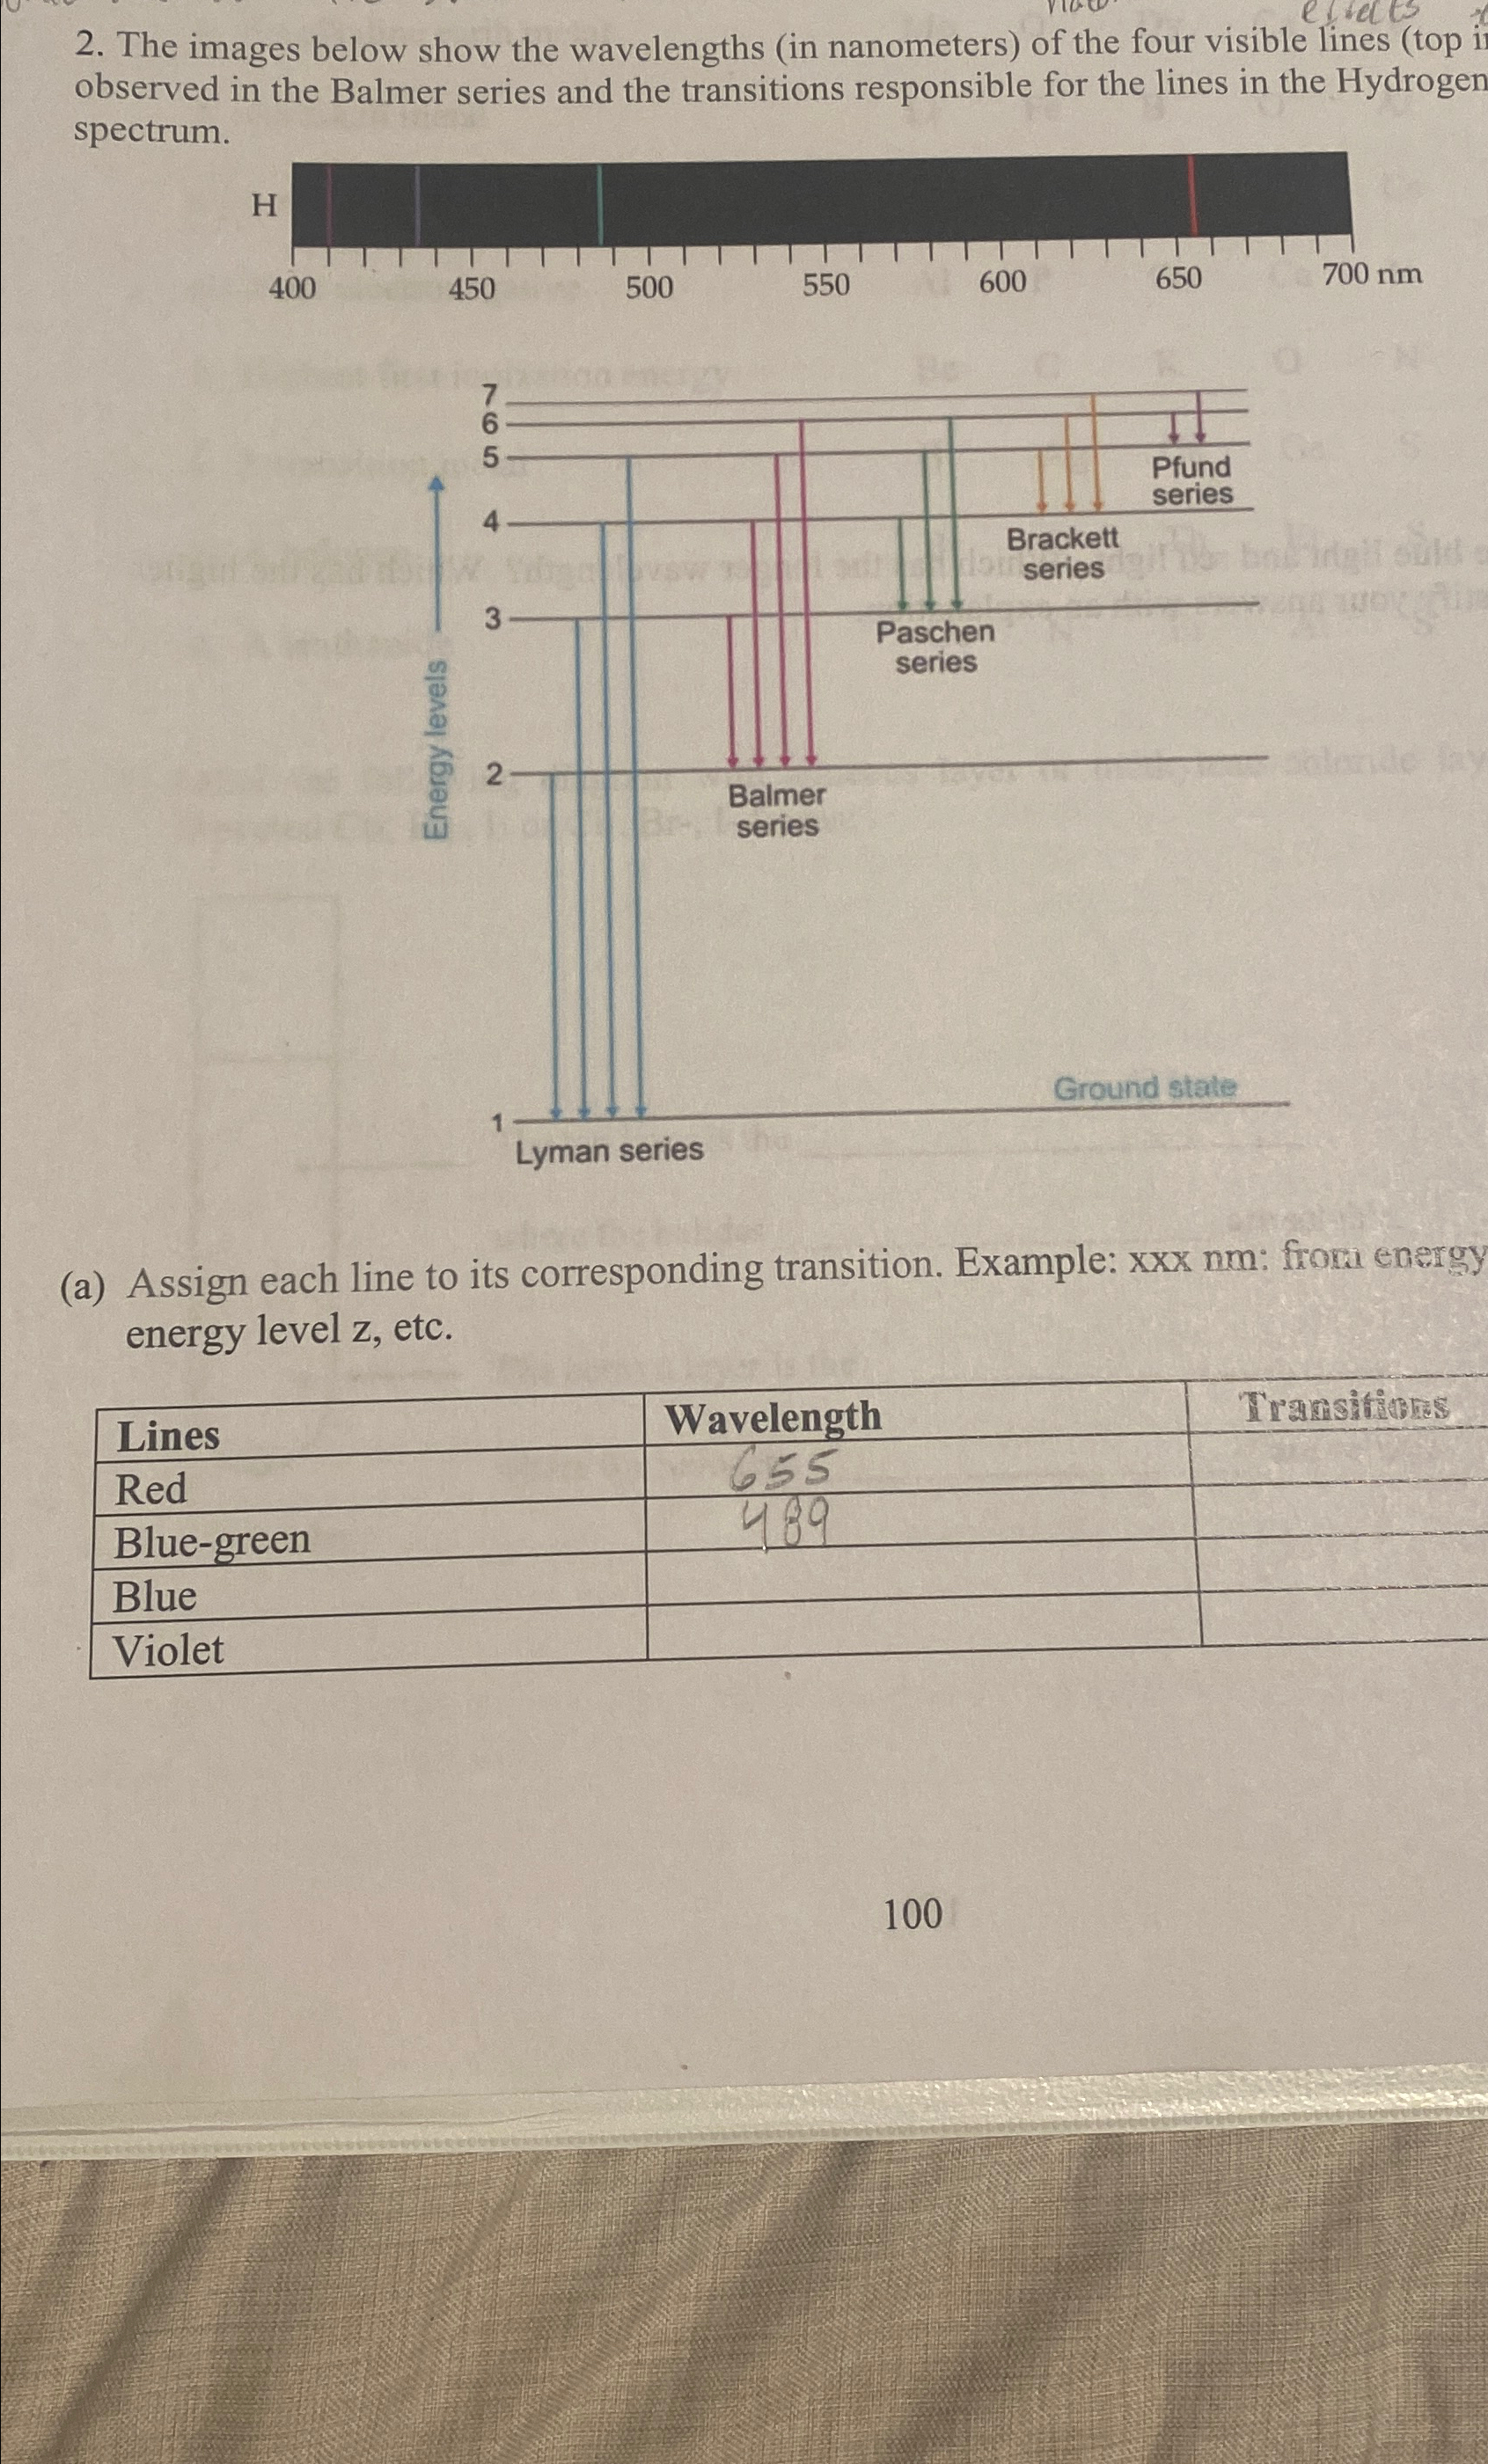
The images below show the wavelengths ( in nanometers ) of the four visible lines ( top i observed in the Balmer series and the
The images below show the wavelengths in nanometers of the four visible lines top i observed in the Balmer series and the transitions responsible for the lines in the Hydrogen spectrum.
a Assign each line to its corresponding transition. Example: XXX : from energy energy level etc.
tableLinesWavelength,TransitionsRedBluegreen,BlueViolet

Step by Step Solution
There are 3 Steps involved in it
Step: 1

Get Instant Access to Expert-Tailored Solutions
See step-by-step solutions with expert insights and AI powered tools for academic success
Step: 2

Step: 3

Ace Your Homework with AI
Get the answers you need in no time with our AI-driven, step-by-step assistance
Get Started


