

Question
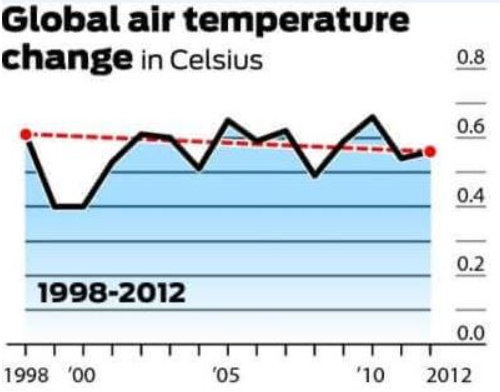
The impact of human activities on earth's climate has been a topic of debate for decades. Below are examples of statistics/graphics posted to support different
The impact of human activities on earth's climate has been a topic of debate for decades. Below are examples of statistics/graphics posted to support different arguments on the subject matter.
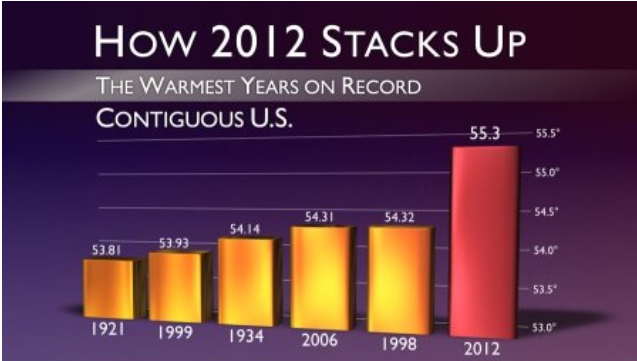
Graphic#1:According to the 2012 National Climate Report conducted by National Oceanic and Atmospheric Administration (NOAA),the contiguous United Stated (CONUS) average annual temperature of 55.3 F was 3.2 F above the 20th century average, and 2012 was the warmest year for the nation in the 1895-2012 period of record. This report was viewed as another evidence that global temperatures are rapidly increasing and the graphic below was created to emphasize the issue. Note: The graphic below wasnotcreated by NOAA.
Your Task
Take the position of a skepticto comment on why facts reported by NOAA might not be appropriately used ((deliberately or not) in the graphic below.
Step by Step Solution
There are 3 Steps involved in it
Step: 1

Get Instant Access to Expert-Tailored Solutions
See step-by-step solutions with expert insights and AI powered tools for academic success
Step: 2

Step: 3
Ace Your Homework with AI
Get the answers you need in no time with our AI-driven, step-by-step assistance
Get Started
Calculus I With Integrated Precalculus
Authors: Laura Taalman
1st Edition
1464153027, 9781464153020