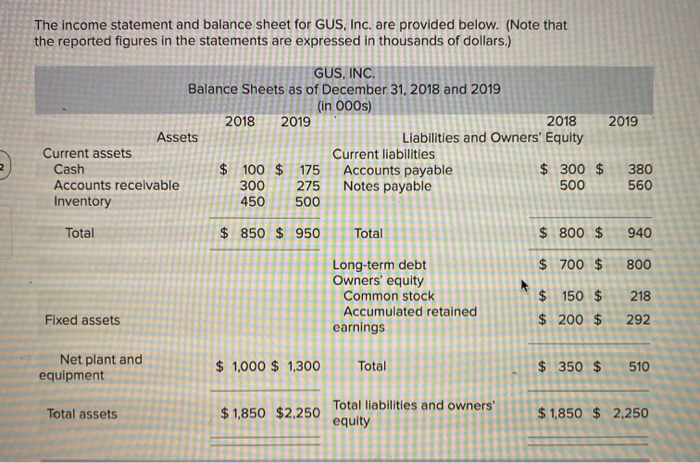
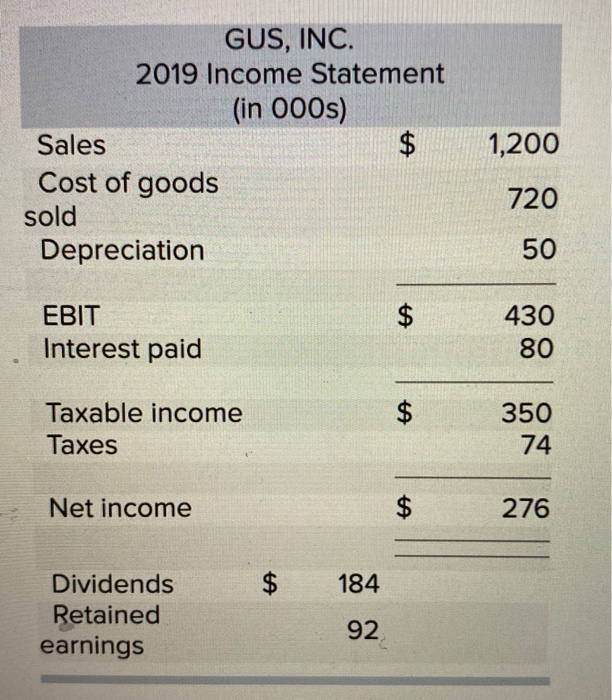
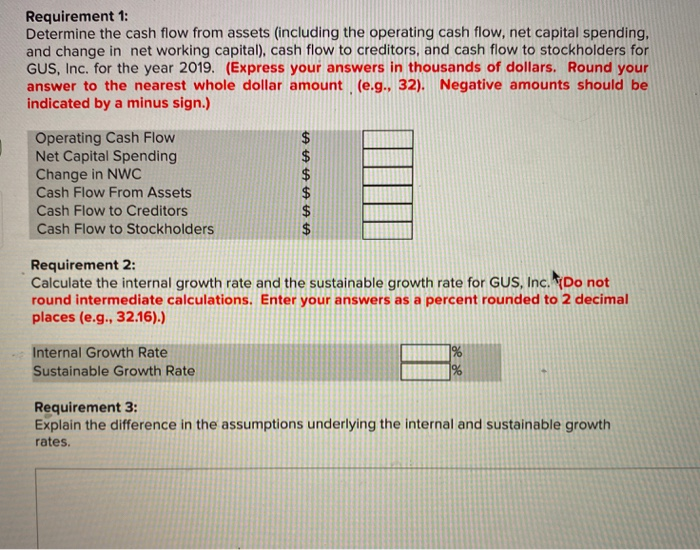
The income statement and balance sheet for GUS, Inc. are provided below. (Note that the reported figures in the statements are expressed in thousands of dollars.) GUS, INC. Balance Sheets as of December 31, 2018 and 2019 (in 000s) 2018 2019 2018 2019 Assets Liabilities and Owners' Equity Current assets Current liabilities Cash $ 100 $ 175 Accounts payable $ 300 $ 380 Accounts receivable 300 275 Notes payable 500 560 Inventory 450 500 Total $ 850 $ 950 Total $ 800 $ 940 $ 700 $ 800 Long-term debt Owners' equity Common stock Accumulated retained earnings 218 $ 150 $ $ 200 $ Fixed assets 292 Net plant and equipment $ 1,000 $ 1,300 Total $ 350 $ 510 Total assets $ 1,850 $2,250 Total liabilities and owners' equity $ 1,850 $ 2,250 GUS, INC. 2019 Income Statement (in 000s) Sales $ Cost of goods sold Depreciation 1,200 720 50 ta EBIT Interest paid 430 80 ta Taxable income Taxes 350 74 Net income $ 276 TA 184 Dividends Retained earnings 92 Requirement 1: Determine the cash flow from assets (including the operating cash flow, net capital spending, and change in net working capital), cash flow to creditors, and cash flow to stockholders for GUS, Inc. for the year 2019. (Express your answers in thousands of dollars. Round your answer to the nearest whole dollar amount (e.g., 32). Negative amounts should be indicated by a minus sign.) Operating Cash Flow Net Capital Spending Change in NWC Cash Flow From Assets Cash Flow to Creditors Cash Flow to Stockholders Requirement 2: Calculate the internal growth rate and the sustainable growth rate for GUS, Inc. Do not round intermediate calculations. Enter your answers as a percent rounded to 2 decimal places (e.g., 32.16).) Internal Growth Rate Sustainable Growth Rate % % Requirement 3: Explain the difference in the assumptions underlying the internal and sustainable growth rates