

Answered step by step
Verified Expert Solution
Question
1 Approved Answer
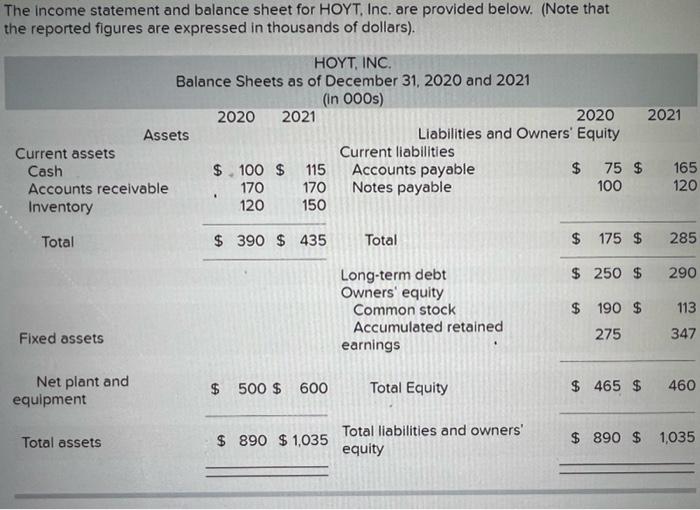
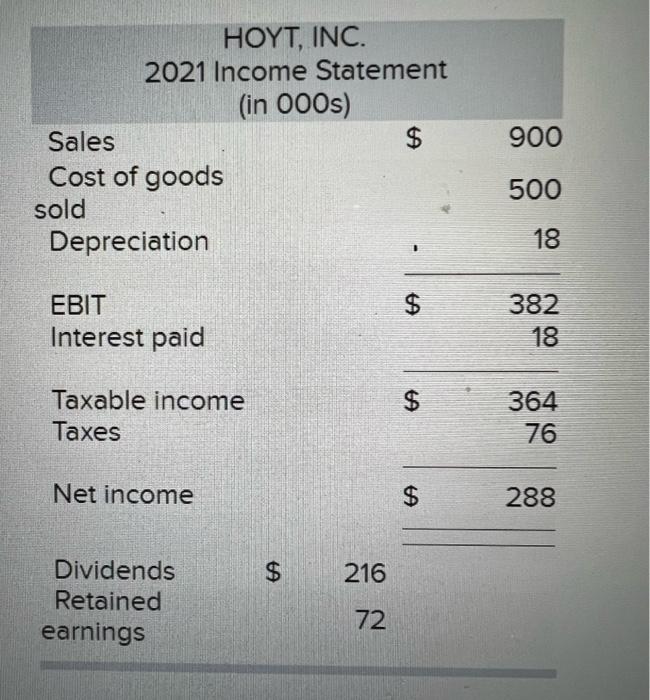
The income statement and balance sheet for HOYT, Inc. are provided below. (Note that the reported figures are expressed in thousands of dollars). Current assets
Step by Step Solution
There are 3 Steps involved in it
Step: 1

Get Instant Access to Expert-Tailored Solutions
See step-by-step solutions with expert insights and AI powered tools for academic success
Step: 2

Step: 3
Ace Your Homework with AI
Get the answers you need in no time with our AI-driven, step-by-step assistance
Get Started
Professionals Handbook Of Financial Risk Management
Authors: Lev Borodovsky, Marc Lore
1st Edition
0750641118, 978-0750641111