Answered step by step
Verified Expert Solution
Question
1 Approved Answer
The income statement and balance sheet of Sheng Siong Group Ltd (Sheng Siong), one of Singapore's largest retailers with 67 stores located across the


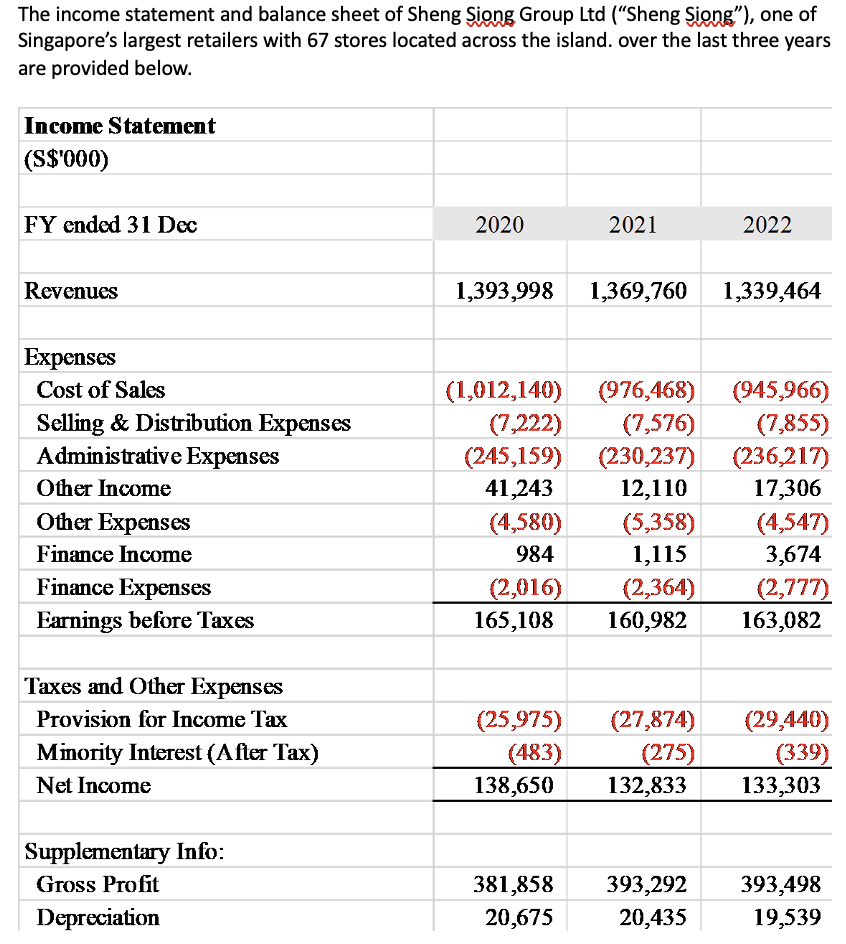
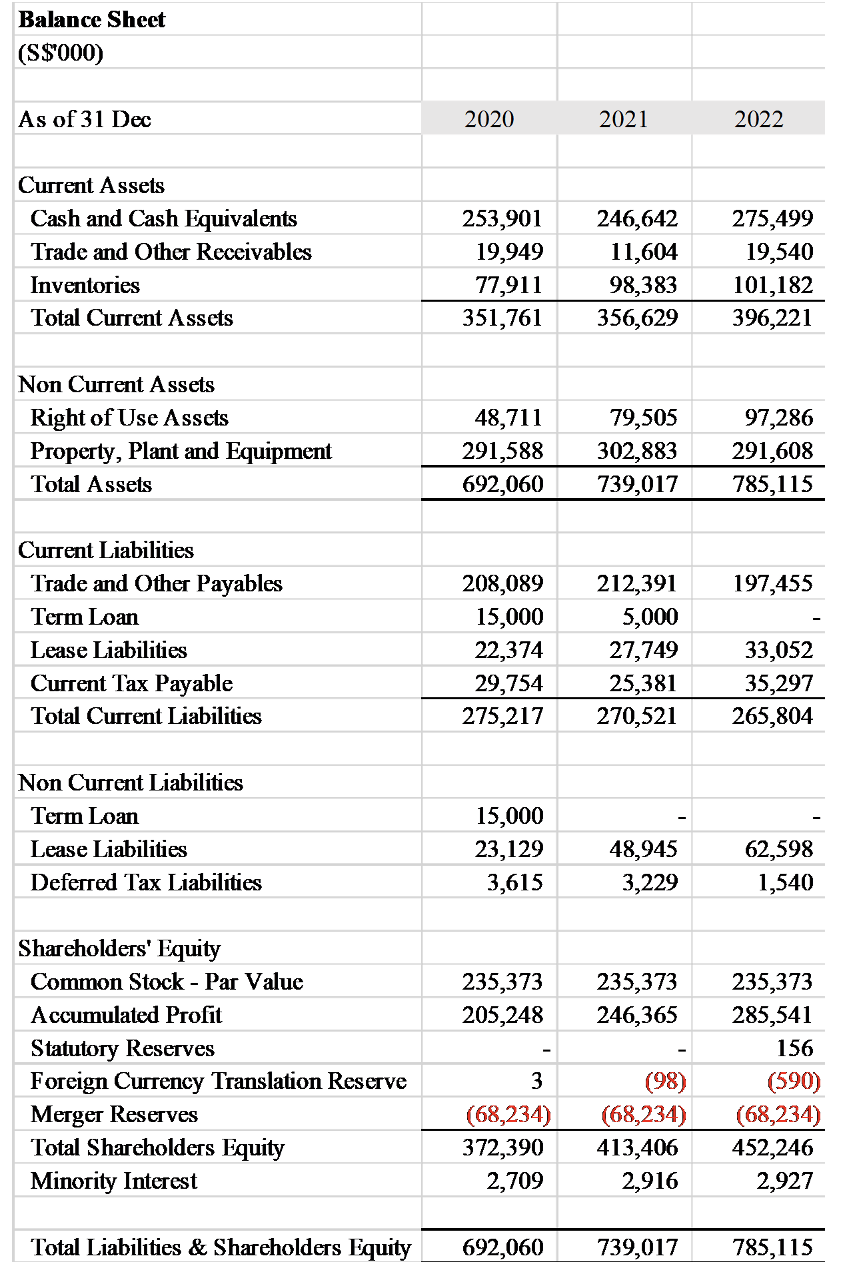
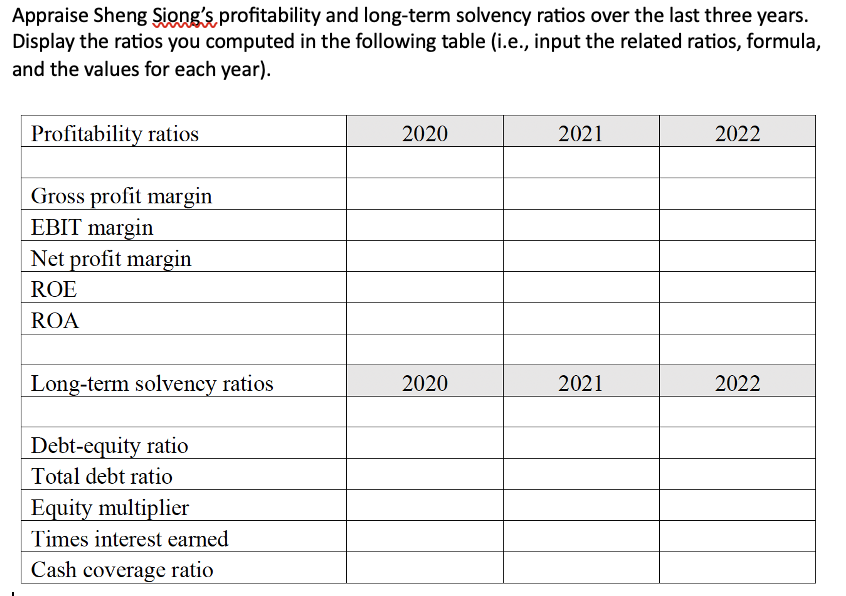
The income statement and balance sheet of Sheng Siong Group Ltd ("Sheng Siong"), one of Singapore's largest retailers with 67 stores located across the island. over the last three years are provided below. Income Statement (S$'000) FY ended 31 Dec Revenues Expenses Cost of Sales Selling & Distribution Expenses Administrative Expenses Other Income Other Expenses Finance Income Finance Expenses Earnings before Taxes Taxes and Other Expenses Provision for Income Tax Minority Interest (After Tax) Net Income Supplementary Info: Gross Profit Depreciation 2020 1,393,998 1,369,760 1,339,464 (2,016) 2021 (1,012,140) (976,468) (945,966) (7,222) (7,576) (7,855) (245,159) (230,237) (236,217) 41,243 12,110 17,306 (4,580) 984 165,108 (25,975) (483) 138,650 2022 (5,358) (4,547) 1,115 3,674 (2,364) (2,777) 160,982 163,082 (27,874) (275) 132,833 381,858 393,292 20,675 20,435 (29,440) (339) 133,303 393,498 19,539 Balance Sheet (S$'000) As of 31 Dec Current Assets Cash and Cash Equivalents Trade and Other Receivables Inventories Total Current Assets Non Current Assets Right of Use Assets Property, Plant and Equipment Total Assets Current Liabilities Trade and Other Payables Term Loan Lease Liabilities Current Tax Payable Total Current Liabilities Non Current Liabilities Term Loan Lease Liabilities Deferred Tax Liabilities Shareholders' Equity Common Stock - Par Value Accumulated Profit Statutory Reserves Foreign Currency Translation Reserve Merger Reserves Total Shareholders Equity Minority Interest Total Liabilities & Shareholders Equity 2020 253,901 246,642 19,949 11,604 77,911 98,383 351,761 356,629 48,711 291,588 692,060 208,089 15,000 22,374 29,754 275,217 15,000 23,129 3,615 235,373 205,248 3 (68,234) 372,390 2,709 2021 692,060 79,505 302,883 739,017 212,391 5,000 27,749 25,381 270,521 48,945 3,229 235,373 246,365 (98) (68,234) 413,406 2,916 739,017 2022 275,499 19,540 101,182 396,221 97,286 291,608 785,115 197,455 33,052 35,297 265,804 62,598 1,540 235,373 285,541 156 (590) (68,234) 452,246 2,927 785,115 Appraise Sheng Sing's profitability and long-term solvency ratios over the last three years. Display the ratios you computed in the following table (i.e., input the related ratios, formula, and the values for each year). Profitability ratios Gross profit margin EBIT margin Net profit margin ROE ROA Long-term solvency ratios Debt-equity ratio Total debt ratio Equity multiplier Times interest earned Cash coverage ratio 2020 2020 2021 2021 2022 2022
Step by Step Solution
★★★★★
3.36 Rating (159 Votes )
There are 3 Steps involved in it
Step: 1
2020 Gross Profit Margin Gross ProfitRevenue S381858000S1393998000 2739 EBIT Margin Earnings Before ...
Get Instant Access to Expert-Tailored Solutions
See step-by-step solutions with expert insights and AI powered tools for academic success
Step: 2

Step: 3

Ace Your Homework with AI
Get the answers you need in no time with our AI-driven, step-by-step assistance
Get Started


