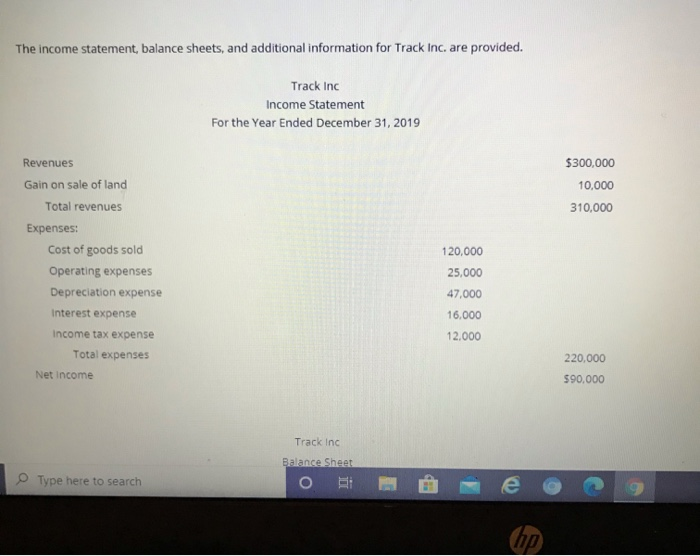
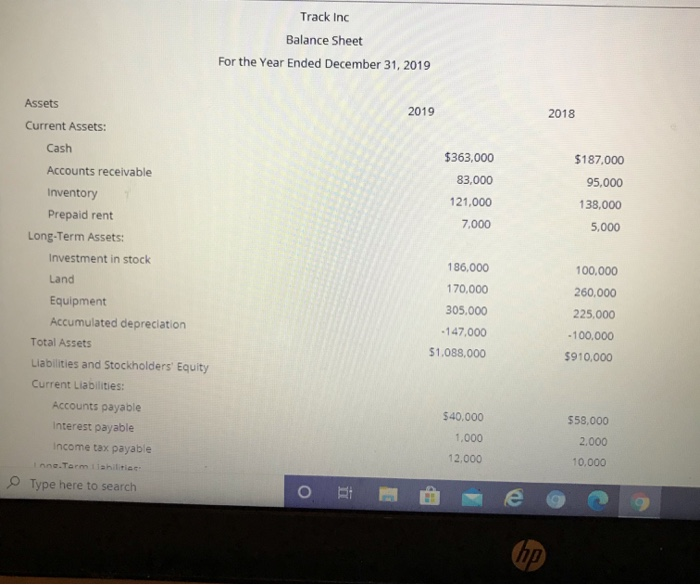
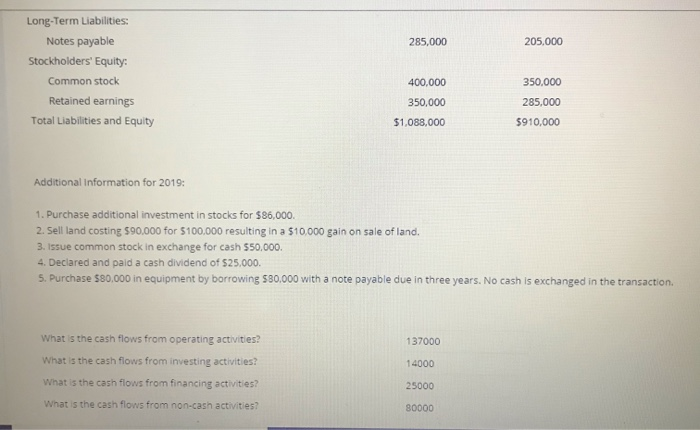
The income statement, balance sheets, and additional information for Track Inc. are provided. Track Inc Income Statement For the Year Ended December 31, 2019 $300,000 10,000 310,000 120,000 Revenues Gain on sale of land Total revenues Expenses: Cost of goods sold Operating expenses Depreciation expense Interest expense Income tax expense Total expenses Net Income 25,000 47,000 16.000 12.000 220,000 590,000 Track Inc Balance Sheet Type here to search e hp Track Inc Balance Sheet For the Year Ended December 31, 2019 Assets 2019 2018 $363,000 $187.000 83,000 95.000 138,000 121,000 7,000 5,000 186,000 100.000 170,000 260.000 Current Assets: Cash Accounts receivable Inventory Prepaid rent Long-Term Assets: Investment in stock Land Equipment Accumulated depreciation Total Assets Liabilities and Stockholders' Equity Current Liabilities: Accounts payable Interest payable Income tax payable ne.Tarm labilities Type here to search 305.000 225,000 - 100.000 - 147,000 $1.088,000 $910,000 $40.000 $58.000 1.000 2.000 12.000 10,000 o hp 285,000 205.000 Long-Term Liabilities: Notes payable Stockholders' Equity: Common stock Retained earnings Total Liabilities and Equity 350.000 400,000 350,000 285.000 $1,088,000 $910,000 Additional Information for 2019: 1. Purchase additional investment in stocks for $86,000 2. Sell land costing 590,000 for $100,000 resulting in a $10,000 gain on sale of land, 3. Issue common stock in exchange for cash $50,000 4. Declared and paid a cash dividend of 525.000. 5. Purchase $80,000 in equipment by borrowing 580,000 with a note payable due in three years. No cash is exchanged in the transaction. What is the cash flows from operating activities? 137000 What is the cash flows from investing activities? 14000 What is the cash flows from financing activities? 25000 What is the cash flows from non-cash activities? 80000