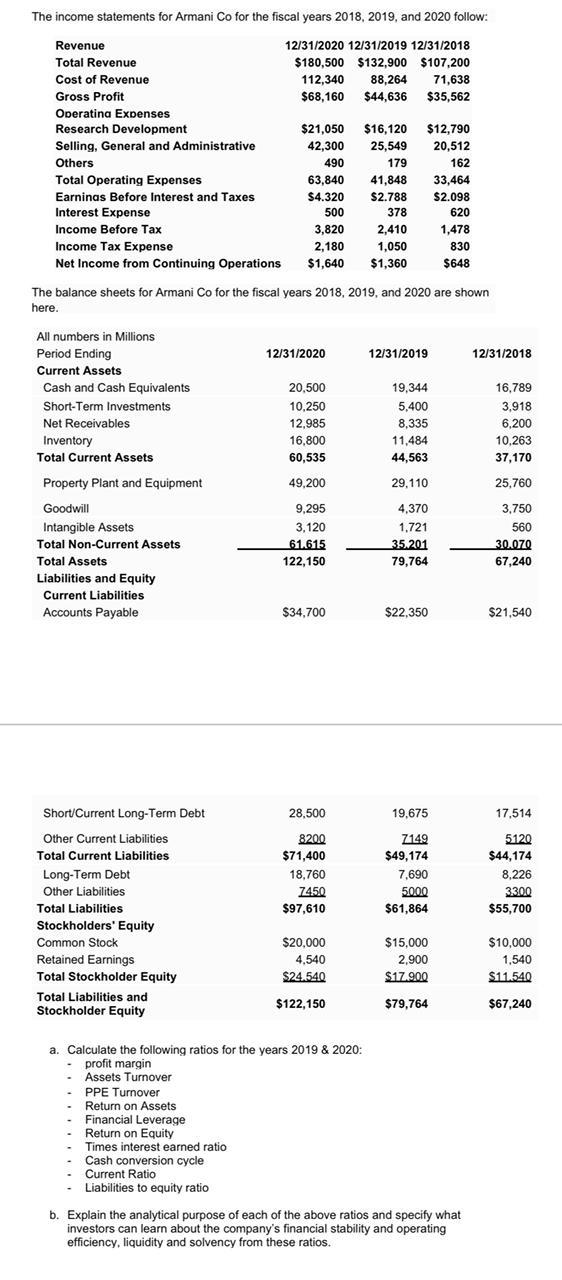
The income statements for Armani Co for the fiscal years 2018, 2019, and 2020 follow: Revenue 12/31/2020 12/31/2019 12/31/2018 Total Revenue $180,500 $132,900 $107,200 Cost of Revenue 112,340 88,264 71,638 Gross Profit $68,160 $44,636 $35,562 Operatina Expenses Research Development $21,050 $16,120 $12,790 Selling, General and Administrative 42,300 25,549 20,512 Others 490 179 162 Total Operating Expenses 63,840 41,848 33,464 Earninas Before Interest and Taxes $4.320 $2.788 $2.098 Interest Expense 500 378 620 Income Before Tax 3,820 2,410 1,478 Income Tax Expense 2,180 1,050 830 Net Income from Continuing Operations $1,640 $1,360 $648 The balance sheets for Armani Co for the fiscal years 2018, 2019, and 2020 are shown here. 12/31/2020 12/31/2019 12/31/2018 20,500 10.250 12,985 16,800 60,535 49.200 19,344 5,400 8,335 11.484 44,563 All numbers in Millions Period Ending Current Assets Cash and Cash Equivalents Short-Term Investments Net Receivables Inventory Total Current Assets Property Plant and Equipment Goodwill Intangible Assets Total Non-Current Assets Total Assets Liabilities and Equity Current Liabilities Accounts Payable 16,789 3,918 6.200 10,263 37,170 29.110 25,760 9,295 3.120 61.615 122.150 4,370 1.721 35.201 79,764 3.750 560 30.070 67,240 $34.700 $22,350 $21.540 Short/Current Long-Term Debt 28,500 19,675 17,514 8200 $71,400 18.760 7450 $97,610 7149 $49,174 7,690 5000 $61,864 5120 $44,174 8,226 33.00 $55,700 Other Current Liabilities Total Current Liabilities Long-Term Debt Other Liabilities Total Liabilities Stockholders' Equity Common Stock Retained Earnings Total Stockholder Equity Total Liabilities and Stockholder Equity $20,000 4,540 $24.540 $15,000 2.900 $17.900 $79,764 $10,000 1,540 $11.540 $122,150 $67,240 a. Calculate the following ratios for the years 2019 & 2020: profit margin Assets Turnover PPE Turnover Return on Assets Financial Leverage Return on Equity Times interest earned ratio Cash conversion cycle Current Ratio Liabilities to equity ratio b. Explain the analytical purpose of each of the above ratios and specify what investors can learn about the company's financial stability and operating efficiency, liquidity and solvency from these ratios


