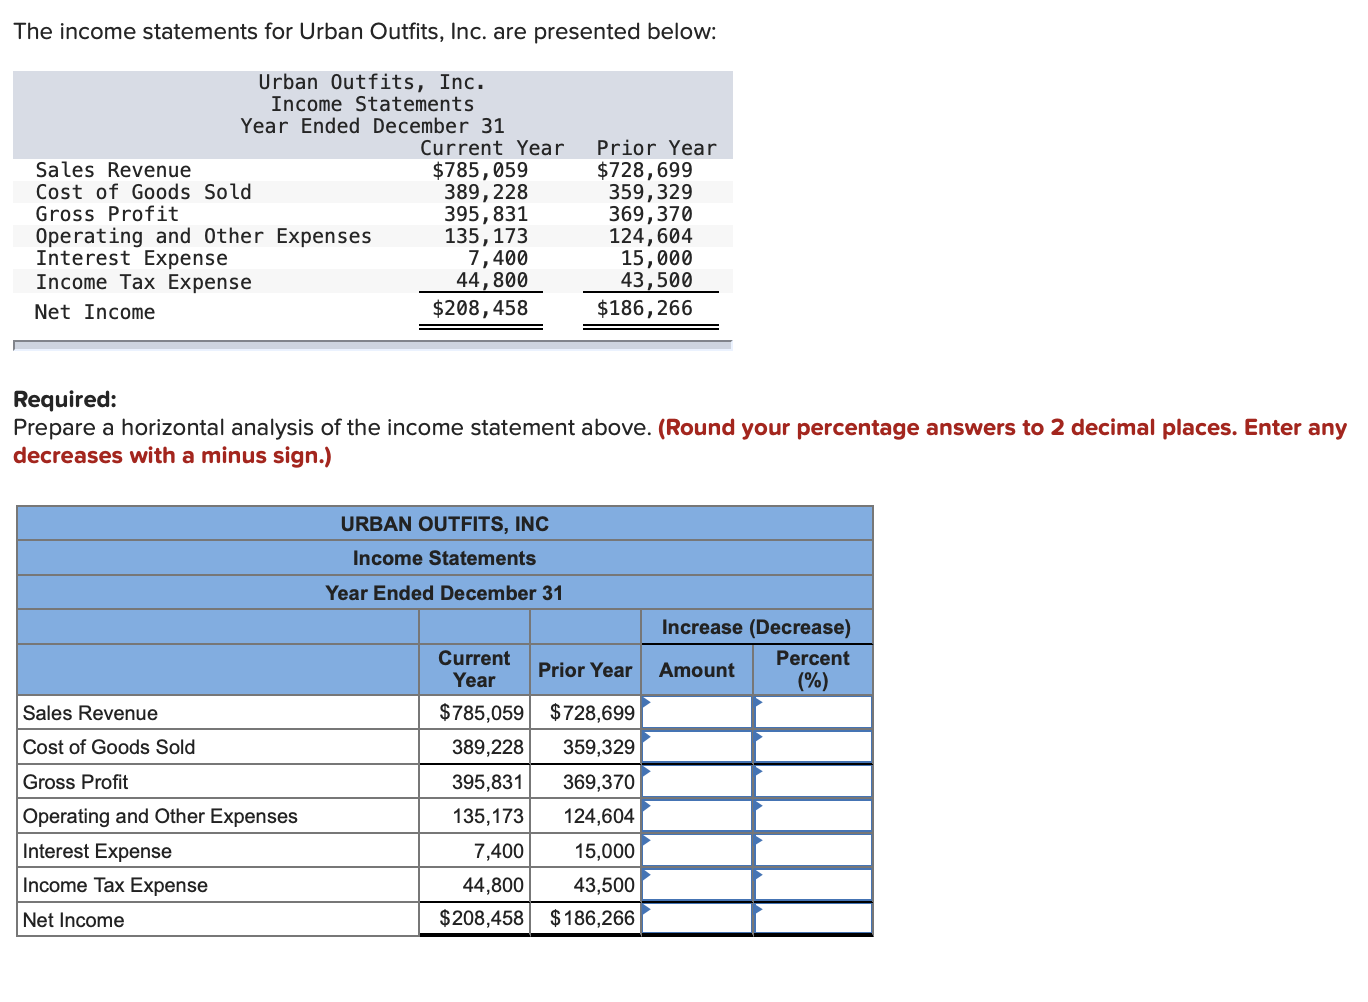
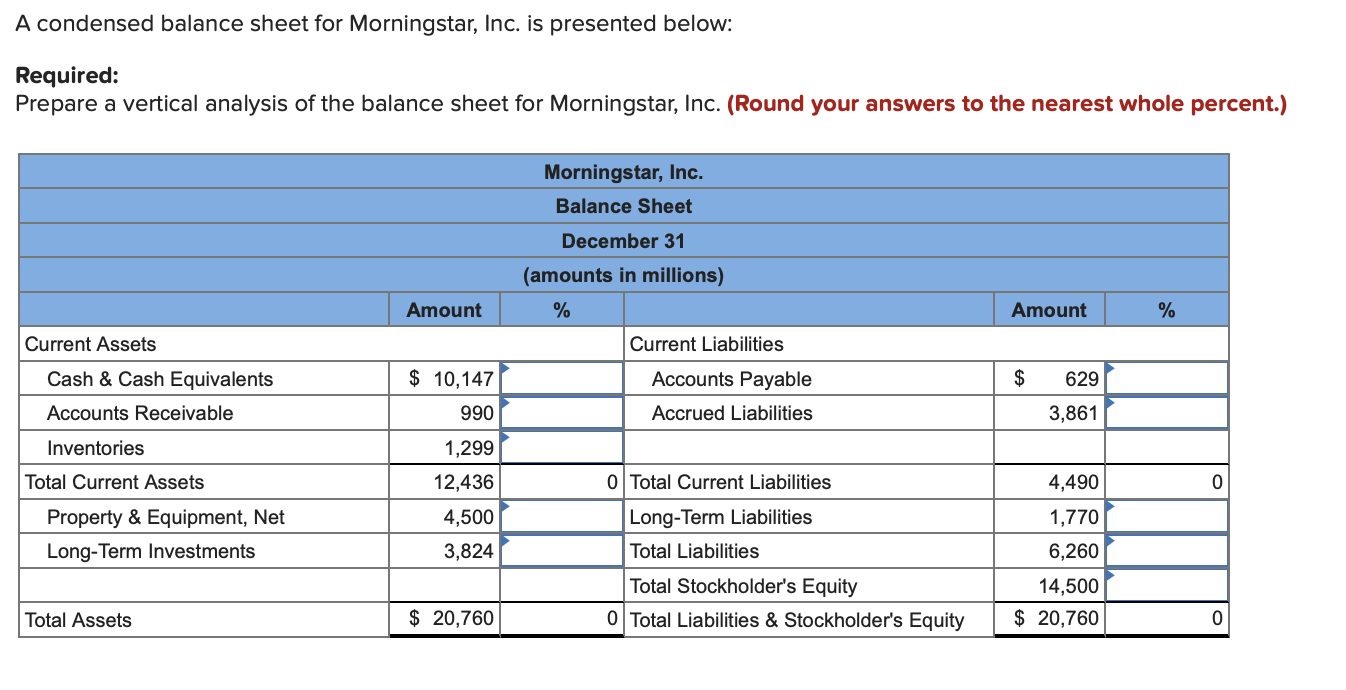
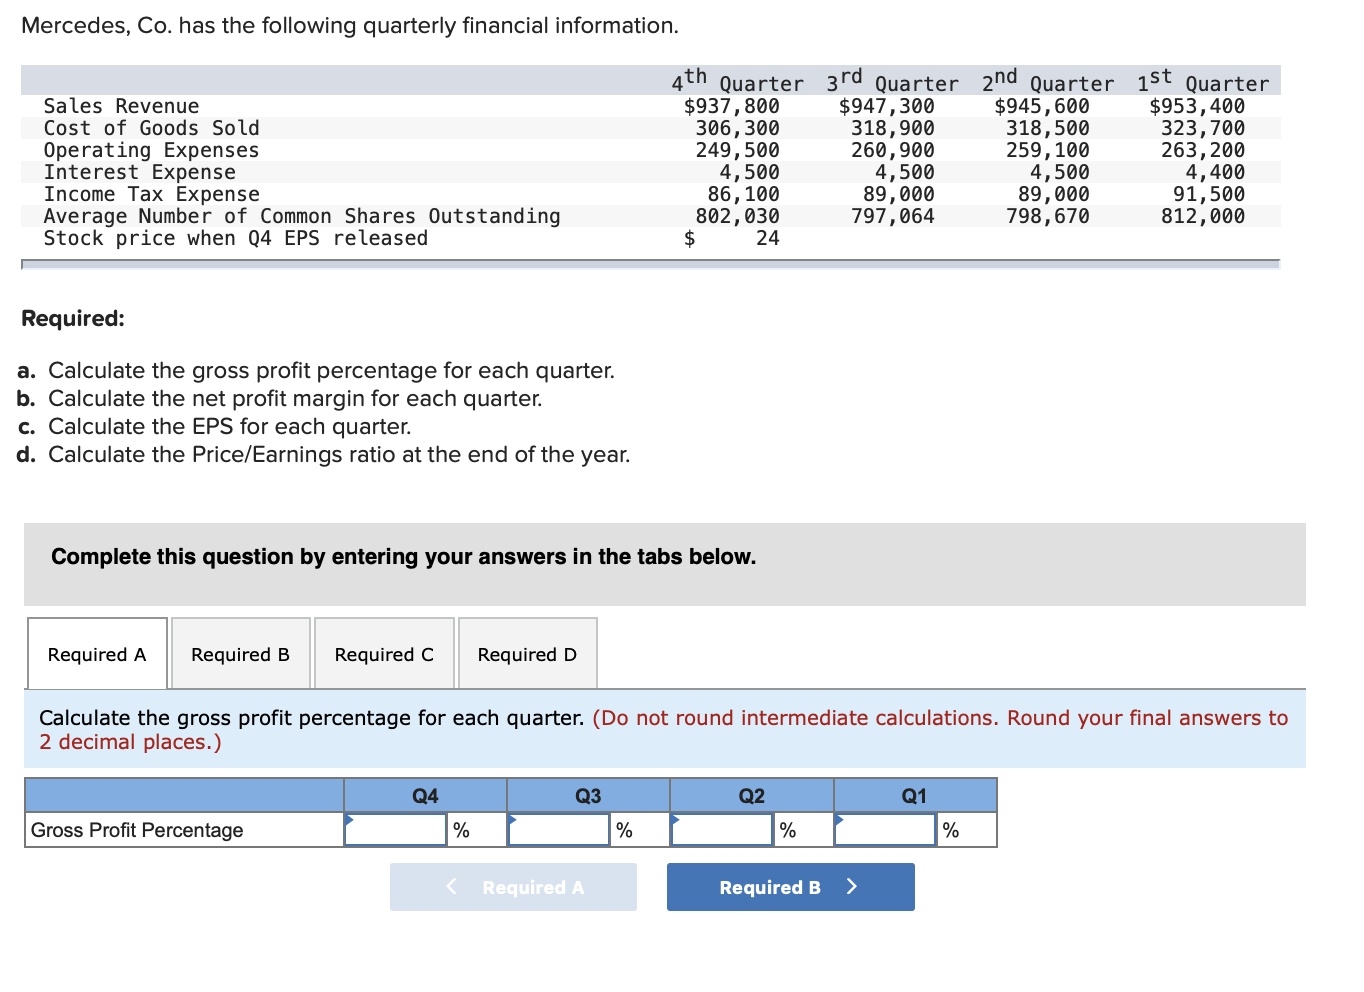
The income statements for Urban Outfits, Inc. are presented below: Urban Outfits, Inc. Income Statements Year Ended December 31 Current Year Sales Revenue $785, 059 Cost of Goods Sold 389, 228 Gross Profit 395,831 Operating and Other Expenses 135, 173 Interest Expense 7,400 Income Tax Expense 44,800 Net Income $208, 458 Prior Year $728,699 359, 329 369,370 124,604 15,000 43,500 $186,266 Required: Prepare a horizontal analysis of the income statement above. (Round your percentage answers to 2 decimal places. Enter any decreases with a minus sign.) URBAN OUTFITS, INC Income Statements Year Ended December 31 Current Year Increase (Decrease) Percent Amount (%) Prior Year Sales Revenue Cost of Goods Sold Gross Profit Operating and Other Expenses Interest Expense Income Tax Expense Net Income $785,059 389,228 395,831 135, 173 7,400 44,800 $208,458 $728,699 359,329 369,370 124,604 15,000 43,500 $186,266 A condensed balance sheet for Morningstar, Inc. is presented below: Required: Prepare a vertical analysis of the balance sheet for Morningstar, Inc. (Round your answers to the nearest whole percent.) Morningstar, Inc. Balance Sheet December 31 (amounts in millions) Amount % Amount % Current Liabilities Current Assets Cash & Cash Equivalents Accounts Receivable $ $ 10,147 990 Accounts Payable Accrued Liabilities 629 3,861 Inventories Total Current Assets 0 Total Current Liabilities 0 1,299 12,436 4,500 3,824 Long-Term Liabilities Property & Equipment, Net Long-Term Investments 4,490 1,770 6,260 Total Liabilities Total Stockholder's Equity 0 Total Liabilities & Stockholder's Equity 14,500 $ 20,760 Total Assets $ 20,760 0 Mercedes, Co. has the following quarterly financial information. Sales Revenue Cost of Goods Sold Operating Expenses Interest Expense Income Tax Expense Average Number of Common Shares Outstanding Stock price when Q4 EPS released th Quarter 3rd Quarter 2nd Quarter 1st Quarter $937,800 $947,300 $945,600 $953,400 306,300 318,900 318,500 323,700 249,500 260, 900 259, 100 263,200 4,500 4,500 4,500 4,400 86, 100 89,000 89,000 91,500 802,030 797,064 798,670 812,000 $ 24 Required: a. Calculate the gross profit percentage for each quarter. b. Calculate the net profit margin for each quarter. c. Calculate the EPS for each quarter. d. Calculate the Price/Earnings ratio at the end of the year. Complete this question by entering your answers in the tabs below. Required A Required B Required C Required D Calculate the gross profit percentage for each quarter. (Do not round intermediate calculations. Round your final answers to 2 decimal places.) Q4 Q3 Q2 Q1 Gross Profit Percentage % % % %