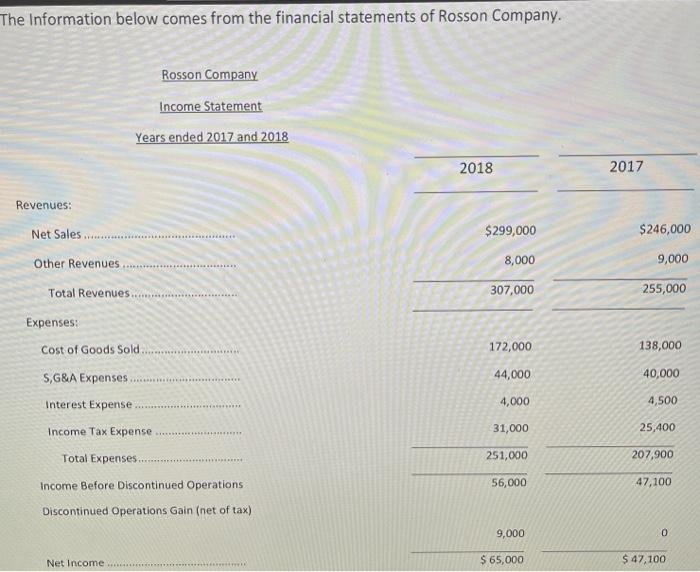
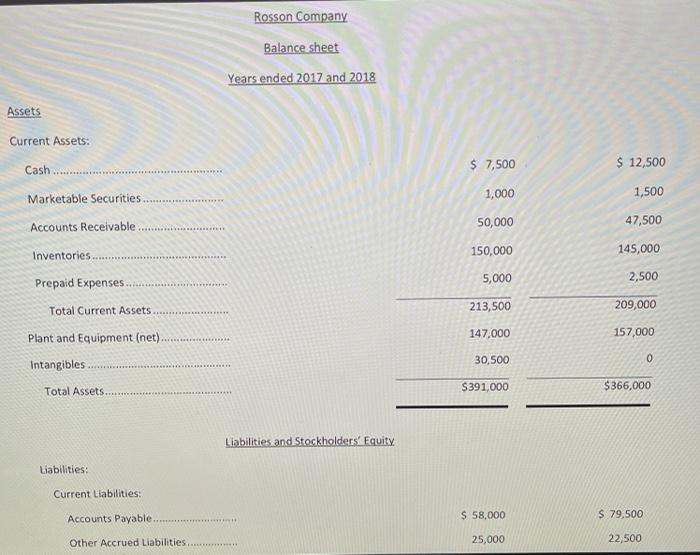
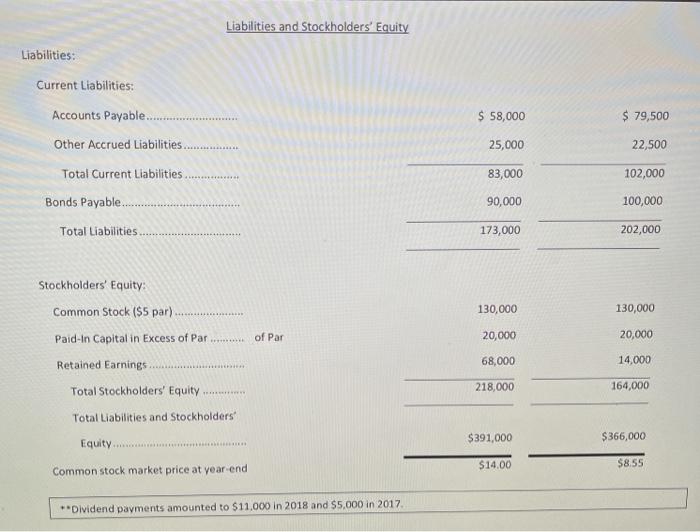
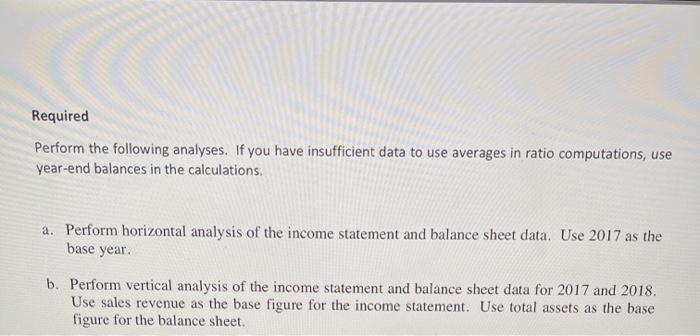
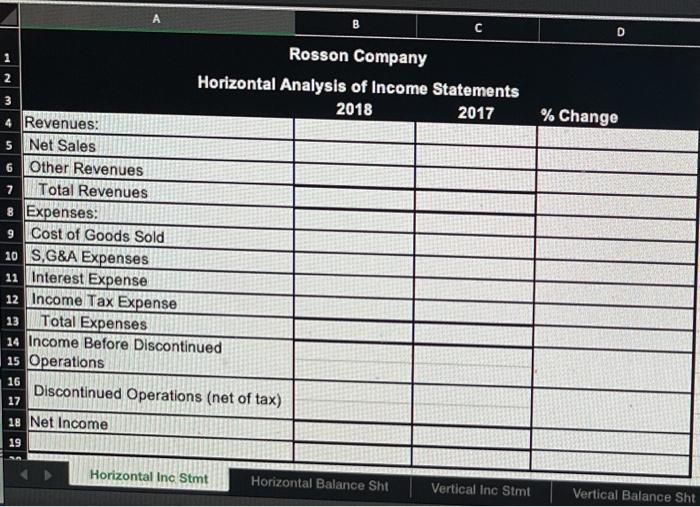
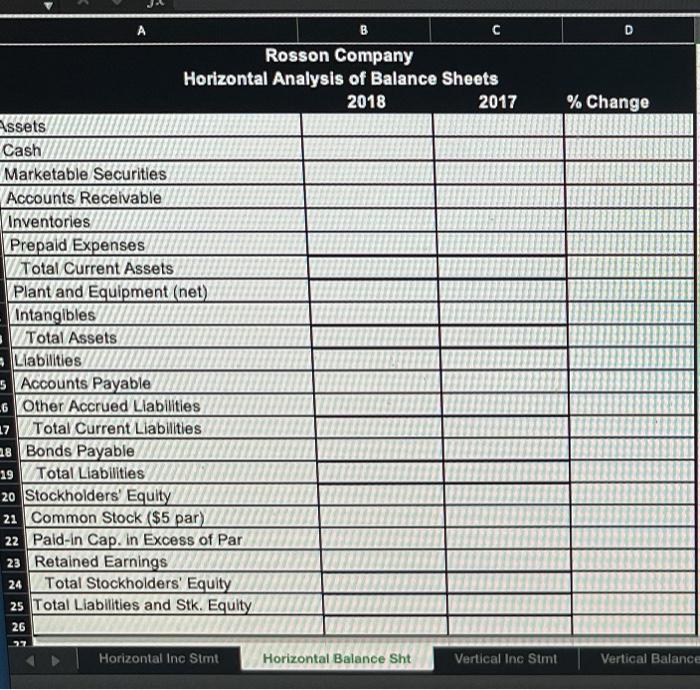
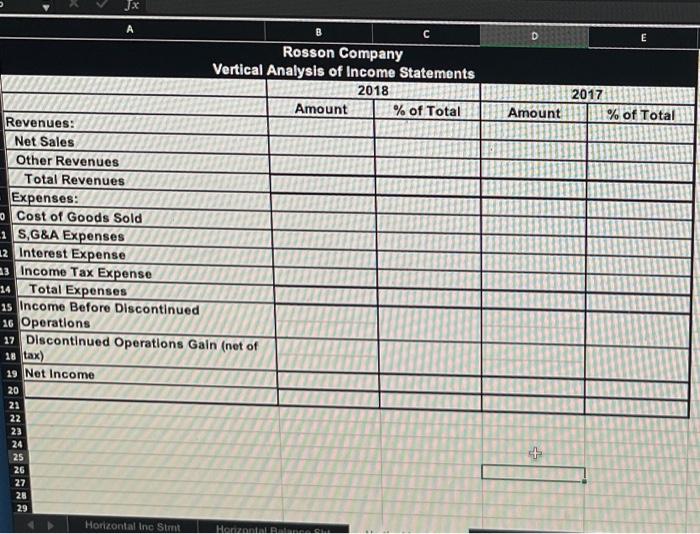
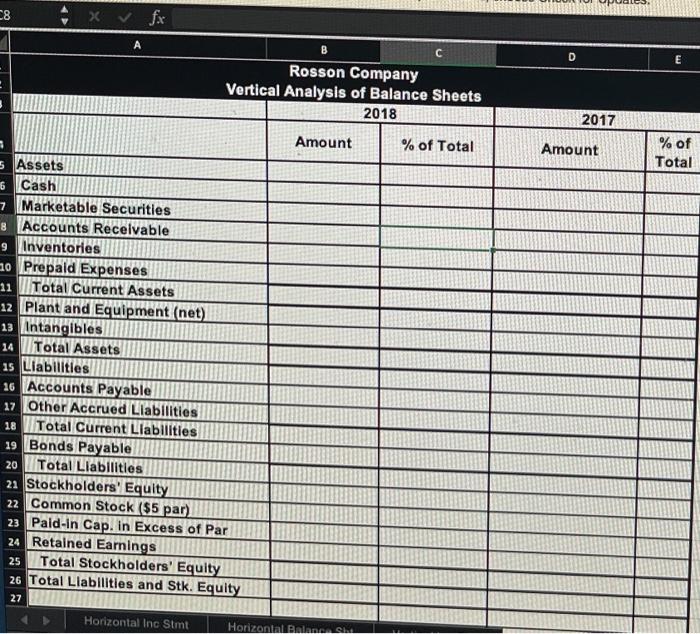
The Information below comes from the financial statements of Rosson Company. Rosson Company Income Statement Years ended 2017 and 2018 2018 2017 Revenues: Net Sales $299,000 $246,000 Other Revenues 8,000 9,000 Total Revenues 307,000 255,000 Expenses: Cost of Goods Sold...................... 172,000 138,000 S,G&A Expenses 44,000 40,000 ***** Interest Expense 4,000 4,500 Income Tax Expense 31,000 25,400 Total Expenses... 251,000 207,900 Income Before Discontinued Operations 56,000 47,100 Discontinued Operations Gain (net of tax) 9,000 0 Net Income $ 65,000 $ 47,100 Rosson Company Balance sheet Years ended 2017 and 2018 Assets Current Assets: Cash $ 7,500 $ 12,500 Marketable Securities 1,000 1,500 Accounts Receivable 50,000 47,500 Inventories 150,000 145,000 Prepaid Expenses 5,000 2,500 Total Current Assets 213,500 209,000 147,000 157,000 Plant and Equipment (net) *** 30,500 0 Intangibles Total Assets. $391,000 $366,000 Liabilities and Stockholders' Equity Liabilities: Current Liabilities: Accounts Payable $ 58,000 $ 79,500 Other Accrued Liabilities 25,000 22,500 Liabilities and Stockholders' Equity Liabilities: Current Liabilities: $ 58,000 $ 79,500 Accounts Payable... Other Accrued Liabilities. 25,000 22,500 Total Current Liabilities. * 83,000 102,000 Bonds Payable........... 90,000 100,000 Total Liabilities 173,000 202,000 Stockholders' Equity: Common Stock ($5 par). 130,000 130,000 20,000 Paid-In Capital in Excess of Par......... of Par 20,000 68,000 14,000 Retained Earnings Total Stockholders' Equity 218,000 164,000 Total Liabilities and Stockholders Equity $366,000 $391,000 $14.00 $8.55 Common stock market price at year-end **Dividend payments amounted to $11,000 in 2018 and $5,000 in 2017 Required Perform the following analyses. If you have insufficient data to use averages in ratio computations, use year-end balances in the calculations. a. Perform horizontal analysis of the income statement and balance sheet data. Use 2017 as the base year. b. Perform vertical analysis of the income statement and balance sheet data for 2017 and 2018. Use sales revenue as the base figure for the income statement. Use total assets as the base figure for the balance sheet. B D 2 % Change 7 Rosson Company Horizontal Analysis of Income Statements 2018 2017 Revenues: 5 Net Sales 6 Other Revenues Total Revenues Expenses: Cost of Goods Sold 10 S, G&A Expenses 11 Interest Expense 12 Income Tax Expense 13 Total Expenses 14 Income Before Discontinued 15 Operations 16 Discontinued Operations (net of tax) 17 18 Net Income 9 19 Horizontal Inc Stmt Horizontal Balance Sht Vertical Inc Stmt Vertical Balance Sht A D % Change B Rosson Company Horizontal Analysis of Balance Sheets 2018 2017 Assets Cash Marketable Securities Accounts Receivable Inventories Prepaid Expenses Total Current Assets Plant and Equipment (net) Intangibles Total Assets Liabilities 5 Accounts Payable -6 Other Accrued Liabilities 17 Total Current Liabilities 28 Bonds Payable 19 Total Liabilities 20 Stockholders' Equity 21 Common Stock ($5 par) 22 Paid-in Cap. In Excess of Par 23 Retained Earnings 24 Total Stockholders' Equity 25 Total Liabilities and Stk. Equity 26 Horizontal Inc Simt Horizontal Balance Sht Vertical Inc Stmt Vertical Balance D E 2017 % of Total Amount JX A B Rosson Company Vertical Analysis of Income Statements 2018 Amount % of Total Revenues: Net Sales Other Revenues Total Revenues Expenses: Cost of Goods Sold - S, G&A Expenses 12 Interest Expense a3 Income Tax Expense Total Expenses 15 Income Before Discontinued 16 Operations 17 Discontinued Operations Gain (net of 18 tax) 19 Net Income 20 21 22 23 24 25 26 27 28 29 Horizontal Ine Sim HALDA + C8 Xfx B D E Rosson Company Vertical Analysis of Balance Sheets 2018 2017 Amount % of Total Amount % of Total 6 5 Assets Cash 7 Marketable Securities 8 Accounts Recelvable 9 Inventories ao Prepaid Expenses 11 Total Current Assets 12 Plant and Equipment (net) 13 Intangibles 14 Total Assets 15 Liabilities 16 Accounts Payable 17 Other Accrued Liabilities 18 Total Current Llabilities 19 Bonds Payable 20 Total Liabilities 21 Stockholders' Equity 22 Common Stock ($5 par) 23 Pald-In Cap. in Excess of Par 24 Retained Earnings 25 Total Stockholders' Equity 26 Total Liabilities and Stk. Equity 27 Horizontal Inc Stmt Horizontal Balan.SI The Information below comes from the financial statements of Rosson Company. Rosson Company Income Statement Years ended 2017 and 2018 2018 2017 Revenues: Net Sales $299,000 $246,000 Other Revenues 8,000 9,000 Total Revenues 307,000 255,000 Expenses: Cost of Goods Sold...................... 172,000 138,000 S,G&A Expenses 44,000 40,000 ***** Interest Expense 4,000 4,500 Income Tax Expense 31,000 25,400 Total Expenses... 251,000 207,900 Income Before Discontinued Operations 56,000 47,100 Discontinued Operations Gain (net of tax) 9,000 0 Net Income $ 65,000 $ 47,100 Rosson Company Balance sheet Years ended 2017 and 2018 Assets Current Assets: Cash $ 7,500 $ 12,500 Marketable Securities 1,000 1,500 Accounts Receivable 50,000 47,500 Inventories 150,000 145,000 Prepaid Expenses 5,000 2,500 Total Current Assets 213,500 209,000 147,000 157,000 Plant and Equipment (net) *** 30,500 0 Intangibles Total Assets. $391,000 $366,000 Liabilities and Stockholders' Equity Liabilities: Current Liabilities: Accounts Payable $ 58,000 $ 79,500 Other Accrued Liabilities 25,000 22,500 Liabilities and Stockholders' Equity Liabilities: Current Liabilities: $ 58,000 $ 79,500 Accounts Payable... Other Accrued Liabilities. 25,000 22,500 Total Current Liabilities. * 83,000 102,000 Bonds Payable........... 90,000 100,000 Total Liabilities 173,000 202,000 Stockholders' Equity: Common Stock ($5 par). 130,000 130,000 20,000 Paid-In Capital in Excess of Par......... of Par 20,000 68,000 14,000 Retained Earnings Total Stockholders' Equity 218,000 164,000 Total Liabilities and Stockholders Equity $366,000 $391,000 $14.00 $8.55 Common stock market price at year-end **Dividend payments amounted to $11,000 in 2018 and $5,000 in 2017 Required Perform the following analyses. If you have insufficient data to use averages in ratio computations, use year-end balances in the calculations. a. Perform horizontal analysis of the income statement and balance sheet data. Use 2017 as the base year. b. Perform vertical analysis of the income statement and balance sheet data for 2017 and 2018. Use sales revenue as the base figure for the income statement. Use total assets as the base figure for the balance sheet. B D 2 % Change 7 Rosson Company Horizontal Analysis of Income Statements 2018 2017 Revenues: 5 Net Sales 6 Other Revenues Total Revenues Expenses: Cost of Goods Sold 10 S, G&A Expenses 11 Interest Expense 12 Income Tax Expense 13 Total Expenses 14 Income Before Discontinued 15 Operations 16 Discontinued Operations (net of tax) 17 18 Net Income 9 19 Horizontal Inc Stmt Horizontal Balance Sht Vertical Inc Stmt Vertical Balance Sht A D % Change B Rosson Company Horizontal Analysis of Balance Sheets 2018 2017 Assets Cash Marketable Securities Accounts Receivable Inventories Prepaid Expenses Total Current Assets Plant and Equipment (net) Intangibles Total Assets Liabilities 5 Accounts Payable -6 Other Accrued Liabilities 17 Total Current Liabilities 28 Bonds Payable 19 Total Liabilities 20 Stockholders' Equity 21 Common Stock ($5 par) 22 Paid-in Cap. In Excess of Par 23 Retained Earnings 24 Total Stockholders' Equity 25 Total Liabilities and Stk. Equity 26 Horizontal Inc Simt Horizontal Balance Sht Vertical Inc Stmt Vertical Balance D E 2017 % of Total Amount JX A B Rosson Company Vertical Analysis of Income Statements 2018 Amount % of Total Revenues: Net Sales Other Revenues Total Revenues Expenses: Cost of Goods Sold - S, G&A Expenses 12 Interest Expense a3 Income Tax Expense Total Expenses 15 Income Before Discontinued 16 Operations 17 Discontinued Operations Gain (net of 18 tax) 19 Net Income 20 21 22 23 24 25 26 27 28 29 Horizontal Ine Sim HALDA + C8 Xfx B D E Rosson Company Vertical Analysis of Balance Sheets 2018 2017 Amount % of Total Amount % of Total 6 5 Assets Cash 7 Marketable Securities 8 Accounts Recelvable 9 Inventories ao Prepaid Expenses 11 Total Current Assets 12 Plant and Equipment (net) 13 Intangibles 14 Total Assets 15 Liabilities 16 Accounts Payable 17 Other Accrued Liabilities 18 Total Current Llabilities 19 Bonds Payable 20 Total Liabilities 21 Stockholders' Equity 22 Common Stock ($5 par) 23 Pald-In Cap. in Excess of Par 24 Retained Earnings 25 Total Stockholders' Equity 26 Total Liabilities and Stk. Equity 27 Horizontal Inc Stmt Horizontal Balan.SI