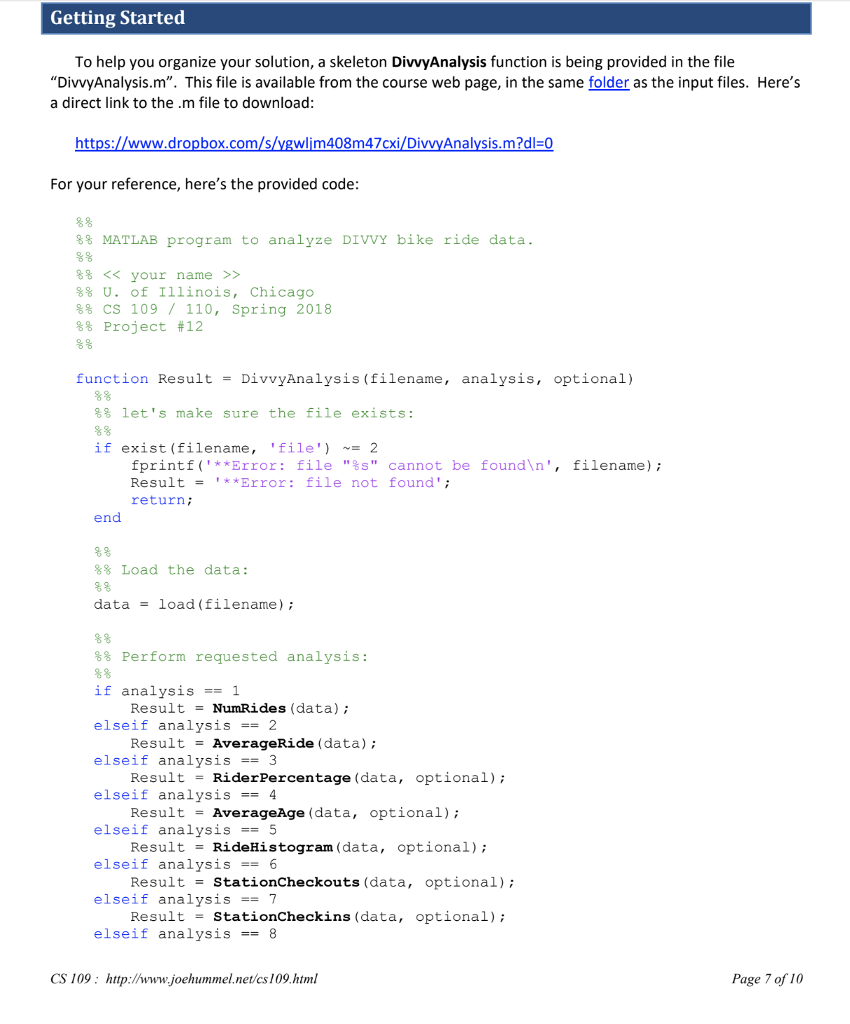
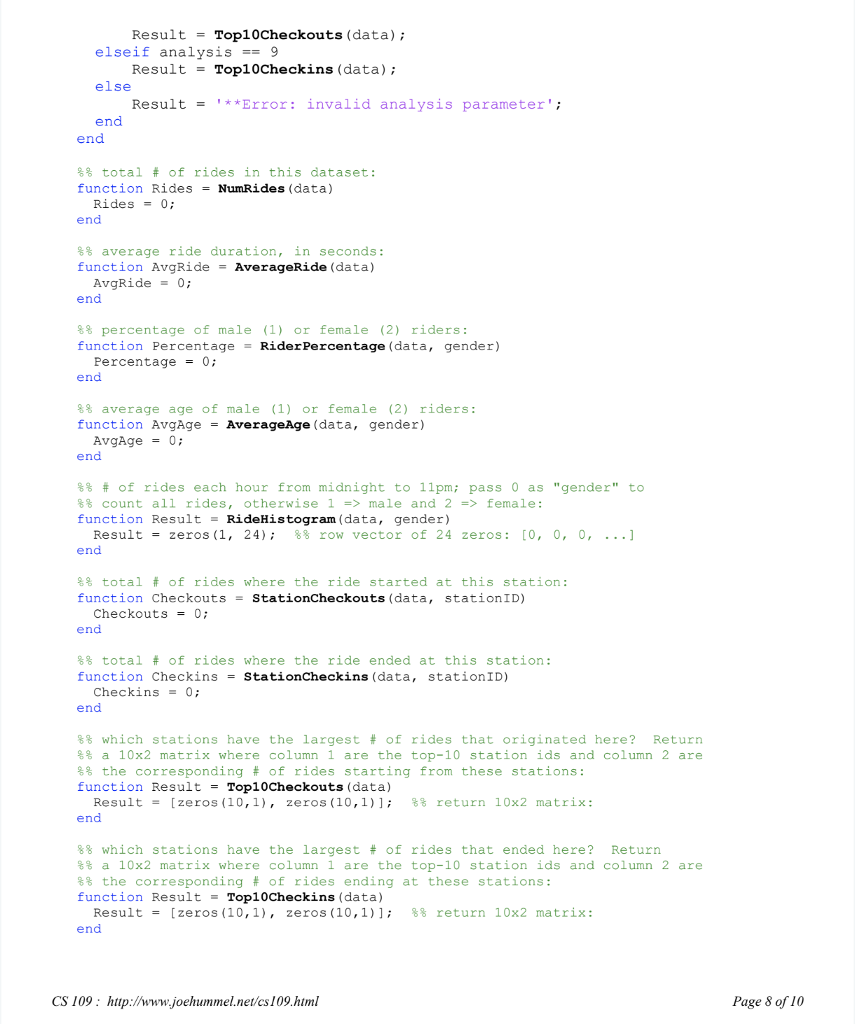
The information for what each part is supposed to do is given in the pictures below by saying what each analysis does. There is some code given for formatting and to make it easier about all the parts needed to do from where it says Getting Started. Please help.
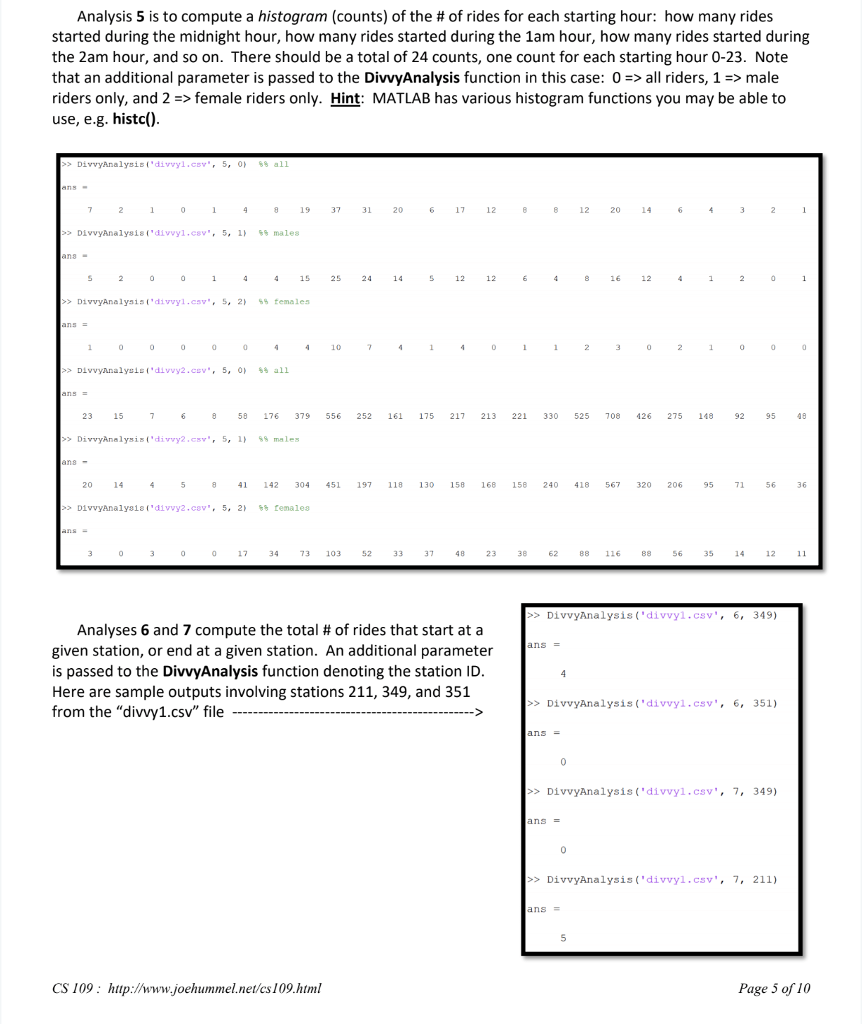
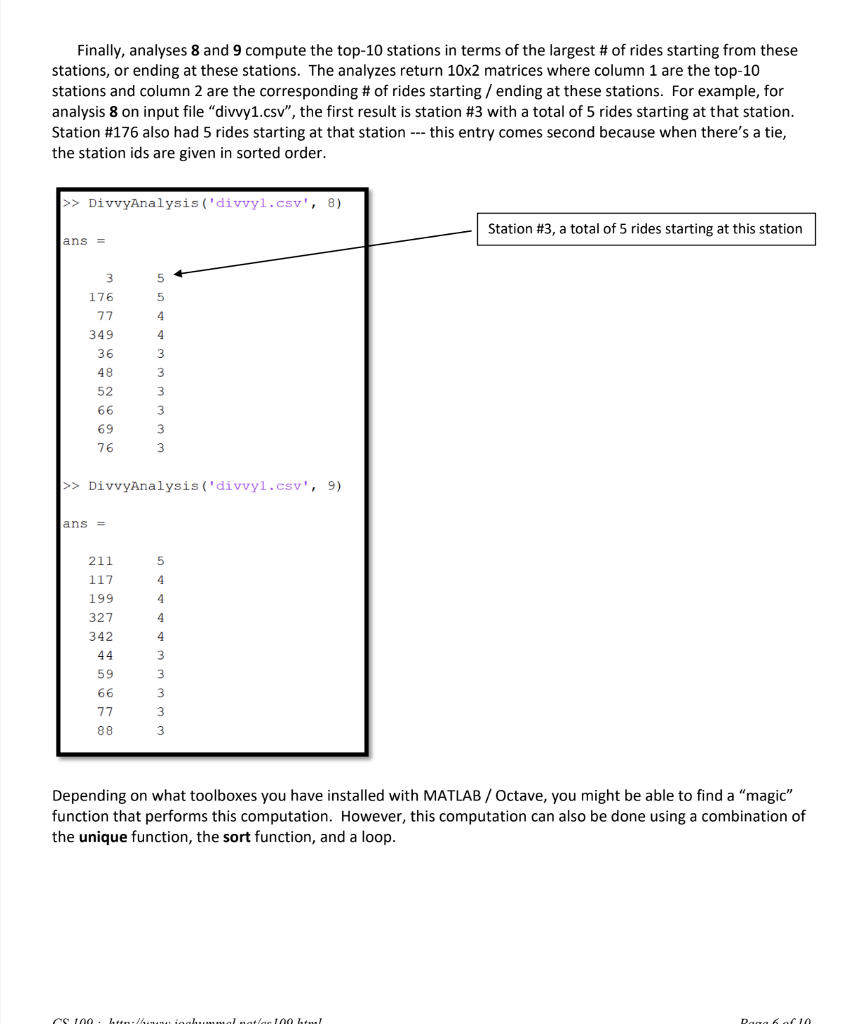
Assignment Divvy is a well-known bike sharing system in Chicago. The company makes data available1 about their stations, ridership, etc. The assignment is to perform some basic analysis of their ridership data. In particular, your task is to write functions that perform the following four analyses: 1, Total # of rides 2. Average duration of a ride, in seconds 3. Average percentage of riders, per gender 4. Average age of riders, per gender 5. Histogram of ride duration, total and per gender 6. Total # of rides starting and ending at a given station 7. The station with the most rides starting, and ending Submissions will be collected via zybooks section 25.11 in the cs109 zybook or section 8.11 in the cs110 zybook. You can work in MATLAB, Octave, or zybooks for this project. Data files The input file is a CSV file ("comma-separated values") that contains ridership data. Each line of the file contains information about one particular ride: the id of the station where the ride started, the id of the station where the ride ended, the bike id, ride duration, etc. Here's the actual file format: 66,171,5292,23,857,1989,1 1 https://www.divvybikes.com/system-data CS 109: http://www.joehummel.net/cs109.html Page I of 10 Assignment Divvy is a well-known bike sharing system in Chicago. The company makes data available1 about their stations, ridership, etc. The assignment is to perform some basic analysis of their ridership data. In particular, your task is to write functions that perform the following four analyses: 1, Total # of rides 2. Average duration of a ride, in seconds 3. Average percentage of riders, per gender 4. Average age of riders, per gender 5. Histogram of ride duration, total and per gender 6. Total # of rides starting and ending at a given station 7. The station with the most rides starting, and ending Submissions will be collected via zybooks section 25.11 in the cs109 zybook or section 8.11 in the cs110 zybook. You can work in MATLAB, Octave, or zybooks for this project. Data files The input file is a CSV file ("comma-separated values") that contains ridership data. Each line of the file contains information about one particular ride: the id of the station where the ride started, the id of the station where the ride ended, the bike id, ride duration, etc. Here's the actual file format: 66,171,5292,23,857,1989,1 1 https://www.divvybikes.com/system-data CS 109: http://www.joehummel.net/cs109.html Page I of 10