Answered step by step
Verified Expert Solution
Question
1 Approved Answer
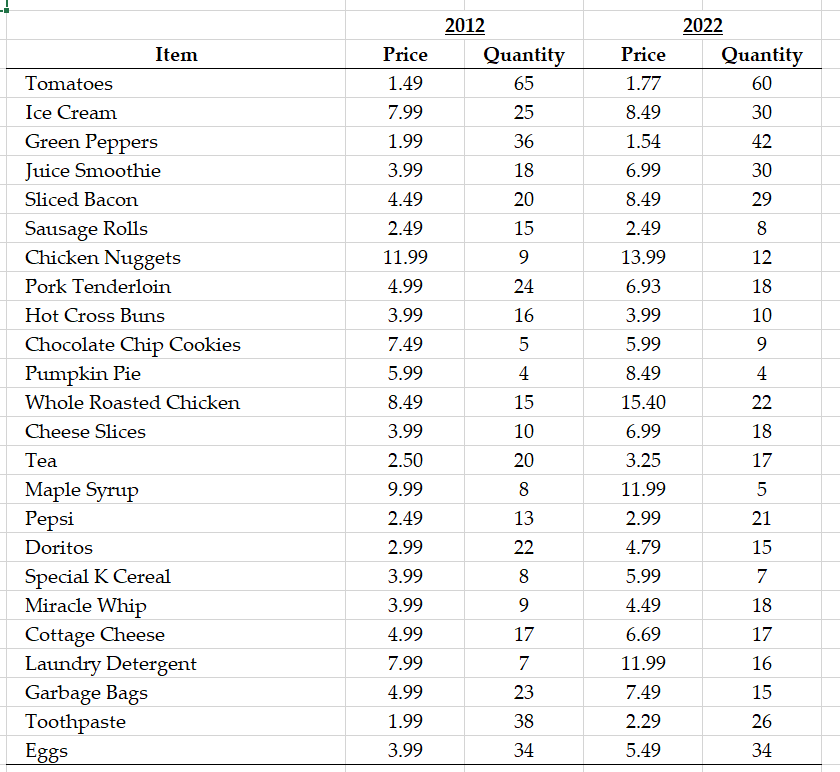
The information provided on the Groceries worksheet in the data pack reports the quantities and prices (measured in dollars) for a selection of items sold
The information provided on the Groceries worksheet in the data pack reports the quantities and prices (measured in dollars) for a selection of items sold by a grocery store on the same day of the year in 2012 (the base period) and 2022. a. Construct and interpret a Laspeyres price index. b. Construct and interpret a Paasche price index. c. Construct and interpret a Fisher's Ideal price index. Price 1.49 7.99 1.99 3.99 4.49 2.49 11.99 4.99 2012 Quantity 65 25 36 18 20 15 9 24 16 5 4 2022 Quantity 60 30 42 30 29 8 12 18 3.99 10 9 4 Item Tomatoes Ice Cream Green Peppers Juice Smoothie Sliced Bacon Sausage Rolls Chicken Nuggets Pork Tenderloin Hot Cross Buns Chocolate Chip Cookies Pumpkin Pie Whole Roasted Chicken Cheese Slices Tea Maple Syrup Pepsi Doritos Special K Cereal Miracle Whip Cottage Cheese Laundry Detergent Garbage Bags Toothpaste Eggs 15 7.49 5.99 8.49 3.99 2.50 9.99 ou Price 1.77 8.49 1.54 6.99 8.49 2.49 13.99 6.93 3.99 5.99 8.49 15.40 6.99 3.25 11.99 2.99 4.79 5.99 4.49 6.69 11.99 7.49 2.29 5.49 22 18 17 5 2.49 0. 10 20 8 13 22 8 9 21 15 2.99 3.99 3.99 7 4.99 17 18 17 16 15 7.99 7 4.99 23 1.99 38 26 3.99 34 34
Step by Step Solution
There are 3 Steps involved in it
Step: 1
Get Instant Access to Expert-Tailored Solutions
See step-by-step solutions with expert insights and AI powered tools for academic success
Step: 2
Step: 3
Ace Your Homework with AI
Get the answers you need in no time with our AI-driven, step-by-step assistance
Get Started