

Question
The investor team decided to make the acquisition. The spreadsheet includes 2019 and 2020 actual results (Chips was purchased effective January 1, 2020, so the
The investor team decided to make the acquisition.
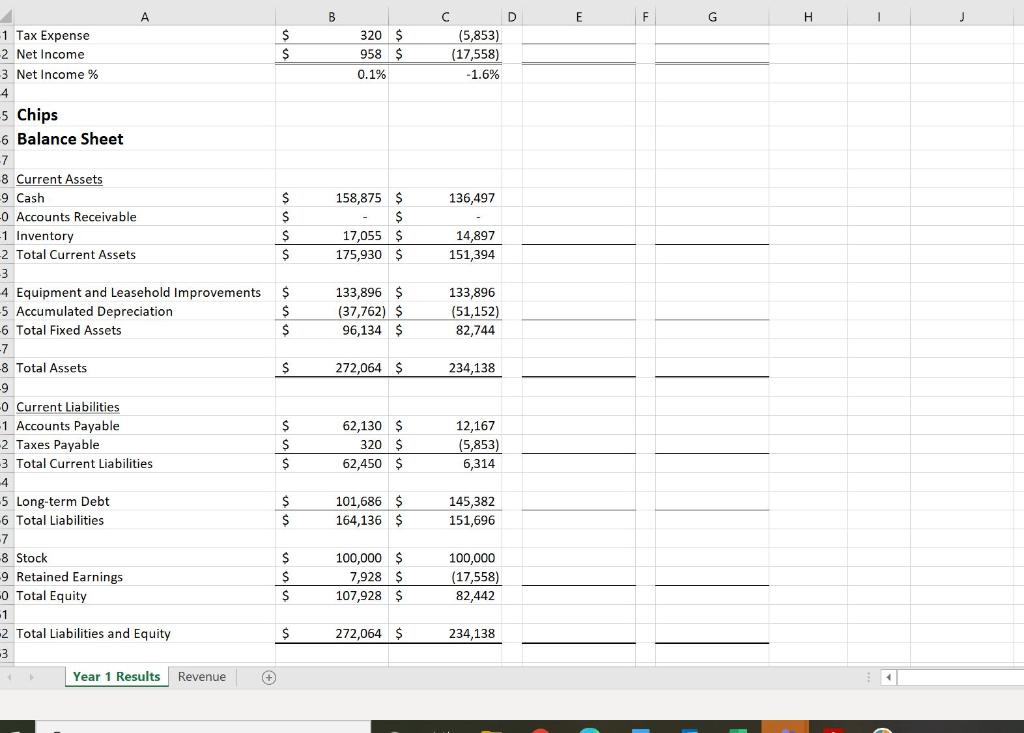
The spreadsheet includes 2019 and 2020 actual results (Chips was purchased effective January 1, 2020, so the 2019 results are just for comparison). Note that retained earnings started 2020 at $0 to reflect the new ownership. The company needed $100,000 of capital from owners (equity) so it issued 100,000 shares of stock at $1 per share.
2020 results include the new method for accounting for direct labor costs (labor costs associated with making the cookies are recorded as the cost of goods sold). Note that accounts payable is only for the direct materials used in making the cookies. Chips also reduced its managers by 1, using 2 managers to manage the 3 stores. In addition, it was able to reduce its lease costs as hoped.
Chips has now completed its first year of operations. Unfortunately, the results were not as good as forecast, resulting in a loss. The CFO needs to report to the Board of Directors and has requested some analysis to understand what happened to cause the loss and also to understand the company's cash flow and working capital. She has one additional significant concernwe have come close to maxing out our line of credit, which is limited to $150,000. She does not want to increase the loan. In fact, she would like to reduce it significantly. She also does not want to receive more equity money (investors).
Please use the Chips (Year 1) Assignment document above to prepare a board of director's report for the CFO. Provide the requested analysis and answers.
Part 1
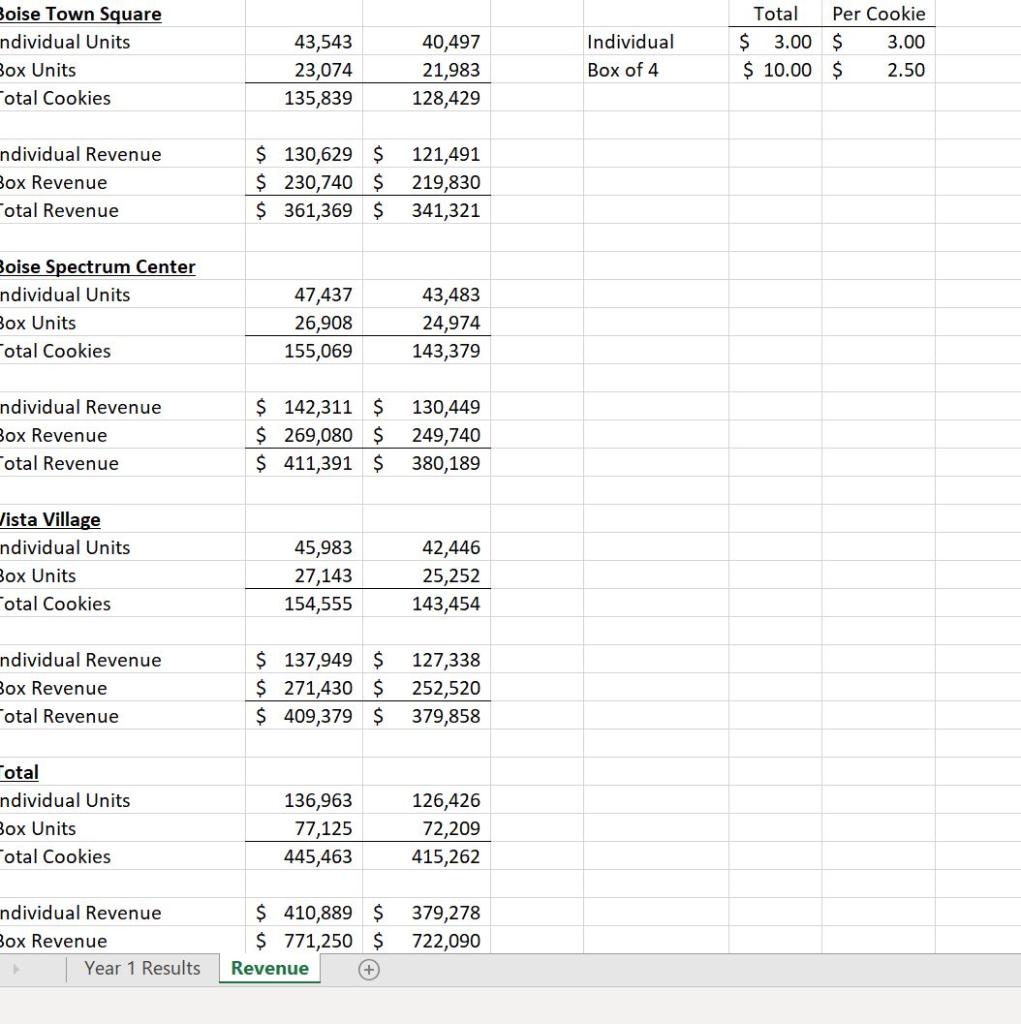
- Based on the Financial Statements, list 3 things that caused the poor performance. Focus on both the income statement and balance sheet. Make sure you give detailsfor example, if revenue was low, why did it go down? Was it because we had a lower average price, or because we sold fewer cookies?
-
List 3 things that were favorable for the year. Explain why they were favorable. Look at both the income statement and the balance sheet for your answers.
- Currently, we do not track Accounts Receivable, even though we actually do have accounts receivable due to the lag between the time we receive credit card payments from our customers and when we actually receive the cash. Please estimate what our accounts receivable balance should be at the end of 2020 by estimating 3 days of sales as Accounts Receivable, and reduce the cash balance by the same amount. In Proforma 1, re-state the balance sheet to reflect the change. Show the proforma current assets section of the balance sheet.
-
Using the 2020 Proforma 1, calculate the number of days of cash for expenses that Chips had on hand at the end of 2020. To do this, use the total of the operating expenses (fixed costs) (adjust for depreciation) and the cost of goods sold (variable costs) for the year (2020) and calculate the average daily need for cash. Then calculate the number of days of cash on the balance sheet at the end of the year. Do you think this is too much, just right, or not enough?
Part 2
- Did we manage our Accounts Payable differently than last year? If so, what was different? Show how you know what was different and be sure to explain what the implications were (Note: You may need to look at the background information of the company - how it was run by the previous owners - to describe the implications).
- We want to get our long-term debt under $45,000. Using the Proforma 1 balance sheet you created in Part 1 as a starting point, create another proforma 2020 income statement and balance sheet (Proforma 2) to reflect changes to working capital processes and/or policies that would have an immediate impact on working capital enough to enable the long-term debt to be less than $45,000. Make at least 3 changes to the management of our working capital processes and/or policies (and their effect on working capital accounts). Show the proforma balance sheet, which should reflect what it would have looked like with your changes. Also show the proforma income statement as the working capital changes could impact the income statement.
- List the key assumptions made to create Proforma 2. Use bullet points to describe the changes in processes and/or policies made and their impact on the financial statements. Remember that these processes and/or policies are best articulated in "days".
4. Analyze the financial statements and list 3 other potential areas of improvement.--- please include the forumlas on excel to i can see how to achieved the answers
Pl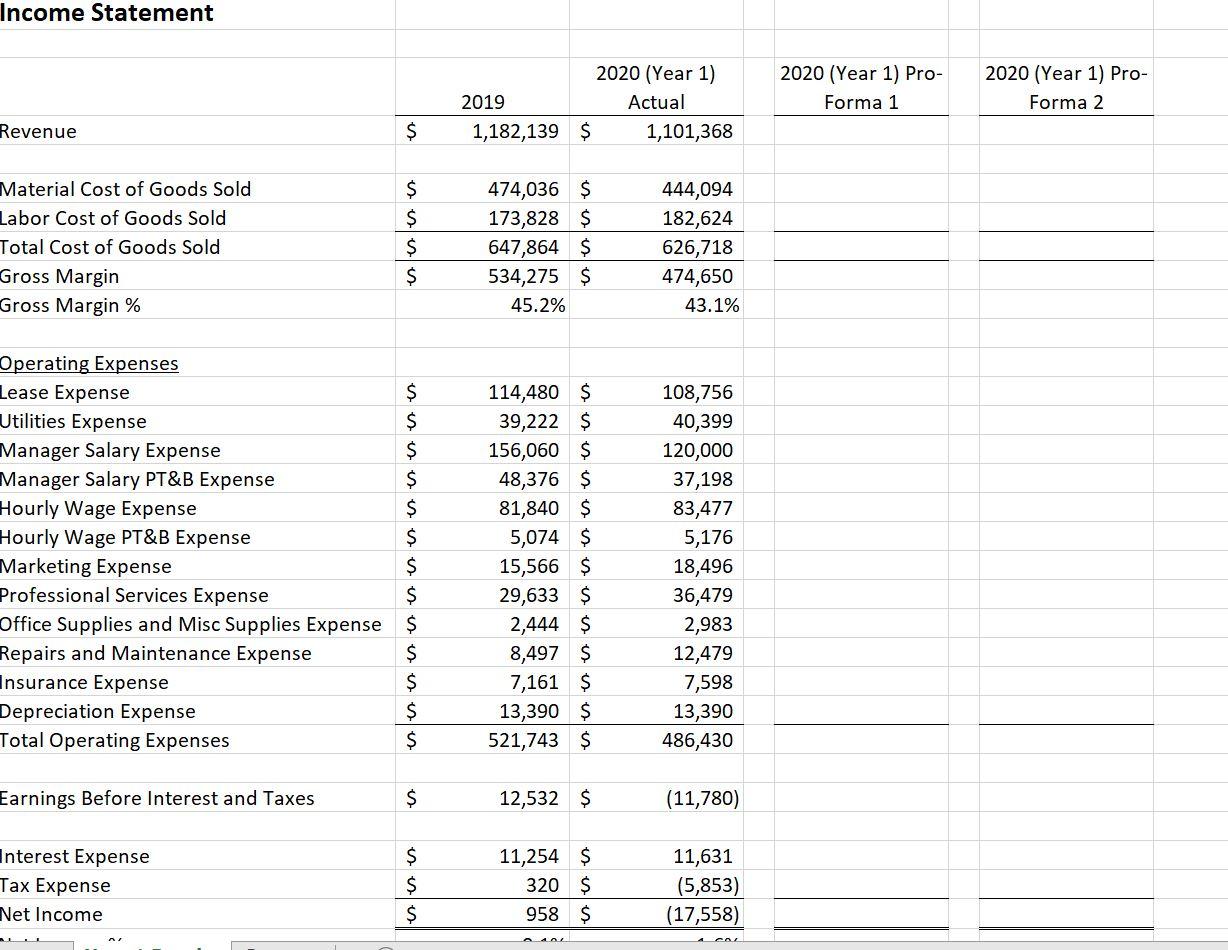
Step by Step Solution
There are 3 Steps involved in it
Step: 1

Get Instant Access to Expert-Tailored Solutions
See step-by-step solutions with expert insights and AI powered tools for academic success
Step: 2

Step: 3
Ace Your Homework with AI
Get the answers you need in no time with our AI-driven, step-by-step assistance
Get Started
Business Forecasting
Authors: John E. Hanke, Dean Wichern
9th edition
132301202, 978-0132301206