Answered step by step
Verified Expert Solution
Link Copied!

Question

1 Approved Answer

The IQ scores of 50 students are given below. 95 100 117 91 96 1 13 87 117 102 106 101 98 98 95 100
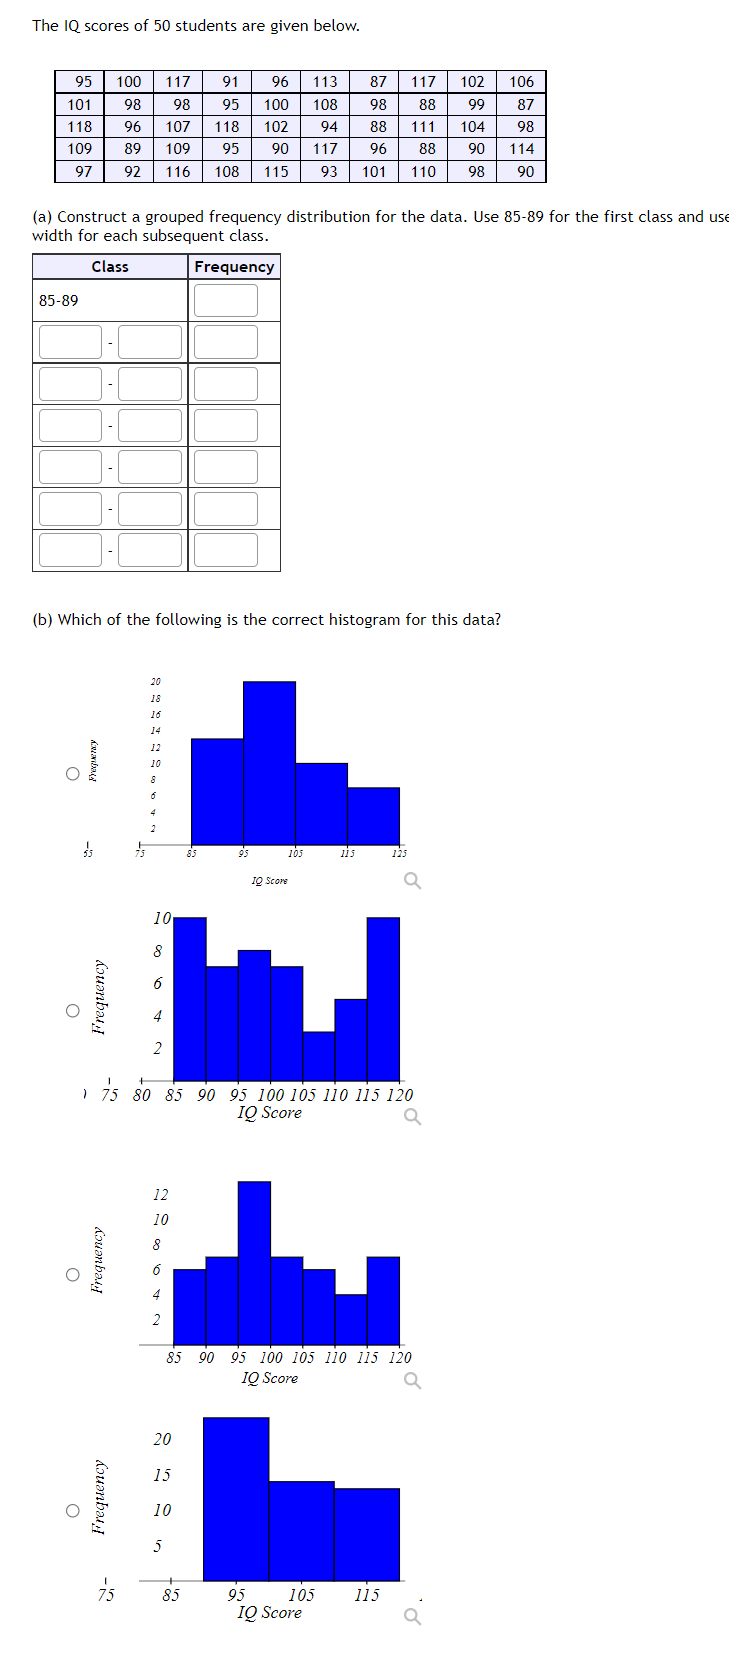
image text in transcribed
The IQ scores of 50 students are given below. 95 100 117 91 96 1 13 87 117 102 106 101 98 98 95 100 108 98 38 99 87 18 96 107 118 102 94 88 111 04 98 109 89 109 95 90 117 96 90 114 97 92 116 108 115 93 101 110 98 90 (a) Construct a grouped frequency distribution for the data. Use 85-89 for the first class and us width for each subsequent class. Class Frequency 85-89 (b) Which of the following is the correct histogram for this data? Frequency O 105 113 125 TO Score Q 10 Frequency O A N 1 75 80 85 90 95 100 105 110 115 120 IQ Score Q Frequency O N 85 90 95 100 105 110 115 120 IQ Score Q 20 15 Frequency O 10 UI 75 85 95 105 115 IQ Score

Step by Step Solution

There are 3 Steps involved in it

Step: 1

blur-text-image

Get Instant Access to Expert-Tailored Solutions

See step-by-step solutions with expert insights and AI powered tools for academic success

Step: 2

blur-text-image

Step: 3

blur-text-image

Ace Your Homework with AI

Get the answers you need in no time with our AI-driven, step-by-step assistance

Get Started

Recommended Textbook for

Linear Algebra With Applications

Authors: Gareth Williams, Williams

9th Edition

1284120104, 9781284120103

More Books

Students also viewed these Mathematics questions