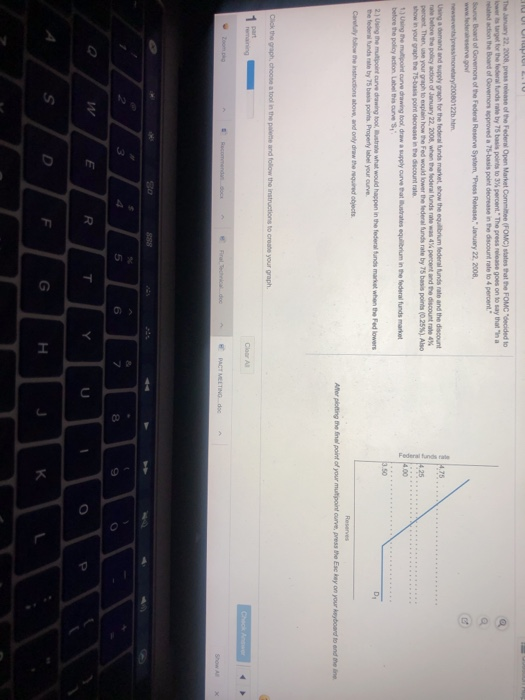
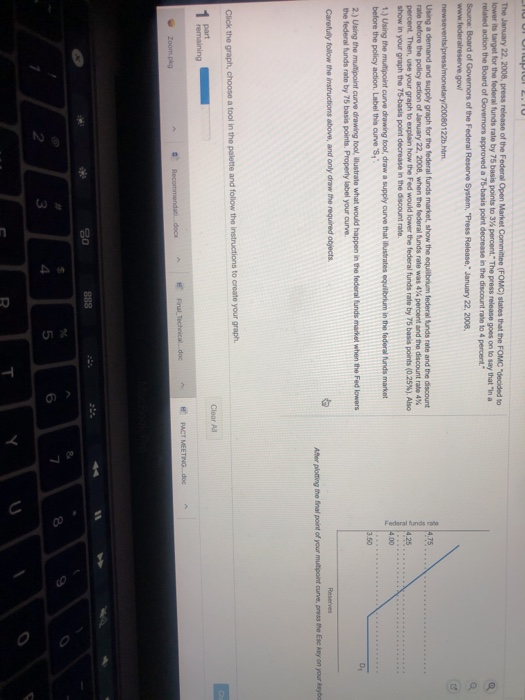
The January 22, 2008. press release of the Federal Open Market Comme (OMC) states that the FOMC decided to stage for the federal funds wie by 75 basis points to 3 percent. The press release goes on to say that ha lated action the Board of Governors proved a 75-asis point decrease in the discount rate to 4 percent Souro Board of Governors of the Federal Reserve System Press Release, January 22, 2008, newsevents press monetary/20080122.htm Using a demand and supplygraph for the federal and market show the brum federal funds rate and the discount me before the policy action of January 22, 2008, when the federal Runds 4% percent and the discount rate 4% percent. Then use your graph to explain how the Fed would lower the federal funds rate by 75 basis points (0.25%). Also show in your graph the 75-asis point decrease in the discount rate 1. Using the point curve drugo draw a supply curve that ustres equirium in the federal funds market before the policy action at this burves 2. Using the m ount curve dwing tool ustre what would happen in the federal and market when the Fed lowers the federal Fundsate by 75 sports Property label your curve Carly the instructions above, and only draw the gured objects Aller plotting the final point of your multipoint curve, press the Eskey on your keyboard to and the line Click the graph. Choose a tool in the paine and follow the instructions to create your graph Recomenda d o ACT MEETING doo CE The January 22, 2008, press release of the Federal Open Market Committee (FOMC) states that the FOMC decided to lower its target for the federal funds rate by 75 basis points to 3% percent. The press release goes on to say that "ina related action the Board of Governors approved a 75-basis point decrease in the discount ratelo 4 percent." Source: Board of Governors of the Federal Reserve System, "Press Release," January 22, 2008, www.federalreserve.gov newsevents/press/monetary/20080122b.htm Using a demand and supply graph for the federal funds market show the equilibrium federal funds rate and the discount rate before the policy action of January 22, 2008, when the federal funds rate was 4% percent and the discount rate 4% percent. Then, use your graph to explain how the Fed would lower the federal funds rate by 75 basis points (0.25%). Also show in your graph the 75-basis point decrease in the discount rate 1.) Using the multipoint curve drawing tool, draw a supply curve that illustrates equilibrium in the federal funds market before the policy action. Label this curve S 2.) Using the multipoint curve drawing tool wlustrate what would happen in the federal funds market when the Fed lowers the federal funds rate by 75 basis points Property label your curve. Carefully follow the instructions above, and only draw the required objects Alor plong the final point of your multipoint curve, press the Ency on your keybo Click the graph, choose a tool in the palette and follow the instructions to create your graph. Clear All remaining Final Technical doc P Recommendati.docx ACT MEETING.doc Zoom.pkg 30 888 RTY The January 22, 2008. press release of the Federal Open Market Committee (FOMC) states that the FOMC decided to lower is target for the federal funds rate by 75 basis points to 3% percent. The press release goes on to say that "Ina related action the Board of Governors approved a 75-asis point decrease in the discount rate to 4 percent. Source: Board of Governors of the Federal Reserve System Press Release" January 22, 2008, www.federadreserve goul newsevents/press/monetary 20080122b.htm Using a demand and supply graph for the federal funds market show the equilibrium federal funds rate and the discount rate before the policy action of January 22, 2008, when the federa unds role was 4 percent and the discount rate 4% percent Then, use your graph to explain how the Fed would lower the federal funds wie by 75 basis points (025%). Ale show in your graph the 75-asis point decrease in the discount rate 1.) Using the multipoint curve drawing tool draw a wupply curve that states equilibrium in the federal funds market before the policy action Label this curve 'S, 2.) Using the multiple curve drawing tool, illustrate what would happen in the federal funds market when the Fed lowers the federal funds rate by 75 basis points Property label your curve Cartely follow the instructions above and only draw the required objects Peserves Aller plotting the final point of your multipoint curve, press the Esc key on your keyboard to end the line The January 22, 2008. press release of the Federal Open Market Comme (OMC) states that the FOMC decided to stage for the federal funds wie by 75 basis points to 3 percent. The press release goes on to say that ha lated action the Board of Governors proved a 75-asis point decrease in the discount rate to 4 percent Souro Board of Governors of the Federal Reserve System Press Release, January 22, 2008, newsevents press monetary/20080122.htm Using a demand and supplygraph for the federal and market show the brum federal funds rate and the discount me before the policy action of January 22, 2008, when the federal Runds 4% percent and the discount rate 4% percent. Then use your graph to explain how the Fed would lower the federal funds rate by 75 basis points (0.25%). Also show in your graph the 75-asis point decrease in the discount rate 1. Using the point curve drugo draw a supply curve that ustres equirium in the federal funds market before the policy action at this burves 2. Using the m ount curve dwing tool ustre what would happen in the federal and market when the Fed lowers the federal Fundsate by 75 sports Property label your curve Carly the instructions above, and only draw the gured objects Aller plotting the final point of your multipoint curve, press the Eskey on your keyboard to and the line Click the graph. Choose a tool in the paine and follow the instructions to create your graph Recomenda d o ACT MEETING doo CE The January 22, 2008, press release of the Federal Open Market Committee (FOMC) states that the FOMC decided to lower its target for the federal funds rate by 75 basis points to 3% percent. The press release goes on to say that "ina related action the Board of Governors approved a 75-basis point decrease in the discount ratelo 4 percent." Source: Board of Governors of the Federal Reserve System, "Press Release," January 22, 2008, www.federalreserve.gov newsevents/press/monetary/20080122b.htm Using a demand and supply graph for the federal funds market show the equilibrium federal funds rate and the discount rate before the policy action of January 22, 2008, when the federal funds rate was 4% percent and the discount rate 4% percent. Then, use your graph to explain how the Fed would lower the federal funds rate by 75 basis points (0.25%). Also show in your graph the 75-basis point decrease in the discount rate 1.) Using the multipoint curve drawing tool, draw a supply curve that illustrates equilibrium in the federal funds market before the policy action. Label this curve S 2.) Using the multipoint curve drawing tool wlustrate what would happen in the federal funds market when the Fed lowers the federal funds rate by 75 basis points Property label your curve. Carefully follow the instructions above, and only draw the required objects Alor plong the final point of your multipoint curve, press the Ency on your keybo Click the graph, choose a tool in the palette and follow the instructions to create your graph. Clear All remaining Final Technical doc P Recommendati.docx ACT MEETING.doc Zoom.pkg 30 888 RTY The January 22, 2008. press release of the Federal Open Market Committee (FOMC) states that the FOMC decided to lower is target for the federal funds rate by 75 basis points to 3% percent. The press release goes on to say that "Ina related action the Board of Governors approved a 75-asis point decrease in the discount rate to 4 percent. Source: Board of Governors of the Federal Reserve System Press Release" January 22, 2008, www.federadreserve goul newsevents/press/monetary 20080122b.htm Using a demand and supply graph for the federal funds market show the equilibrium federal funds rate and the discount rate before the policy action of January 22, 2008, when the federa unds role was 4 percent and the discount rate 4% percent Then, use your graph to explain how the Fed would lower the federal funds wie by 75 basis points (025%). Ale show in your graph the 75-asis point decrease in the discount rate 1.) Using the multipoint curve drawing tool draw a wupply curve that states equilibrium in the federal funds market before the policy action Label this curve 'S, 2.) Using the multiple curve drawing tool, illustrate what would happen in the federal funds market when the Fed lowers the federal funds rate by 75 basis points Property label your curve Cartely follow the instructions above and only draw the required objects Peserves Aller plotting the final point of your multipoint curve, press the Esc key on your keyboard to end the line


