

Answered step by step
Verified Expert Solution
Question
1 Approved Answer
The Kingsley Department Store suffered heavy damage when a hurricane struck on August 31. The store was closed for four months (Sept - Dec) and
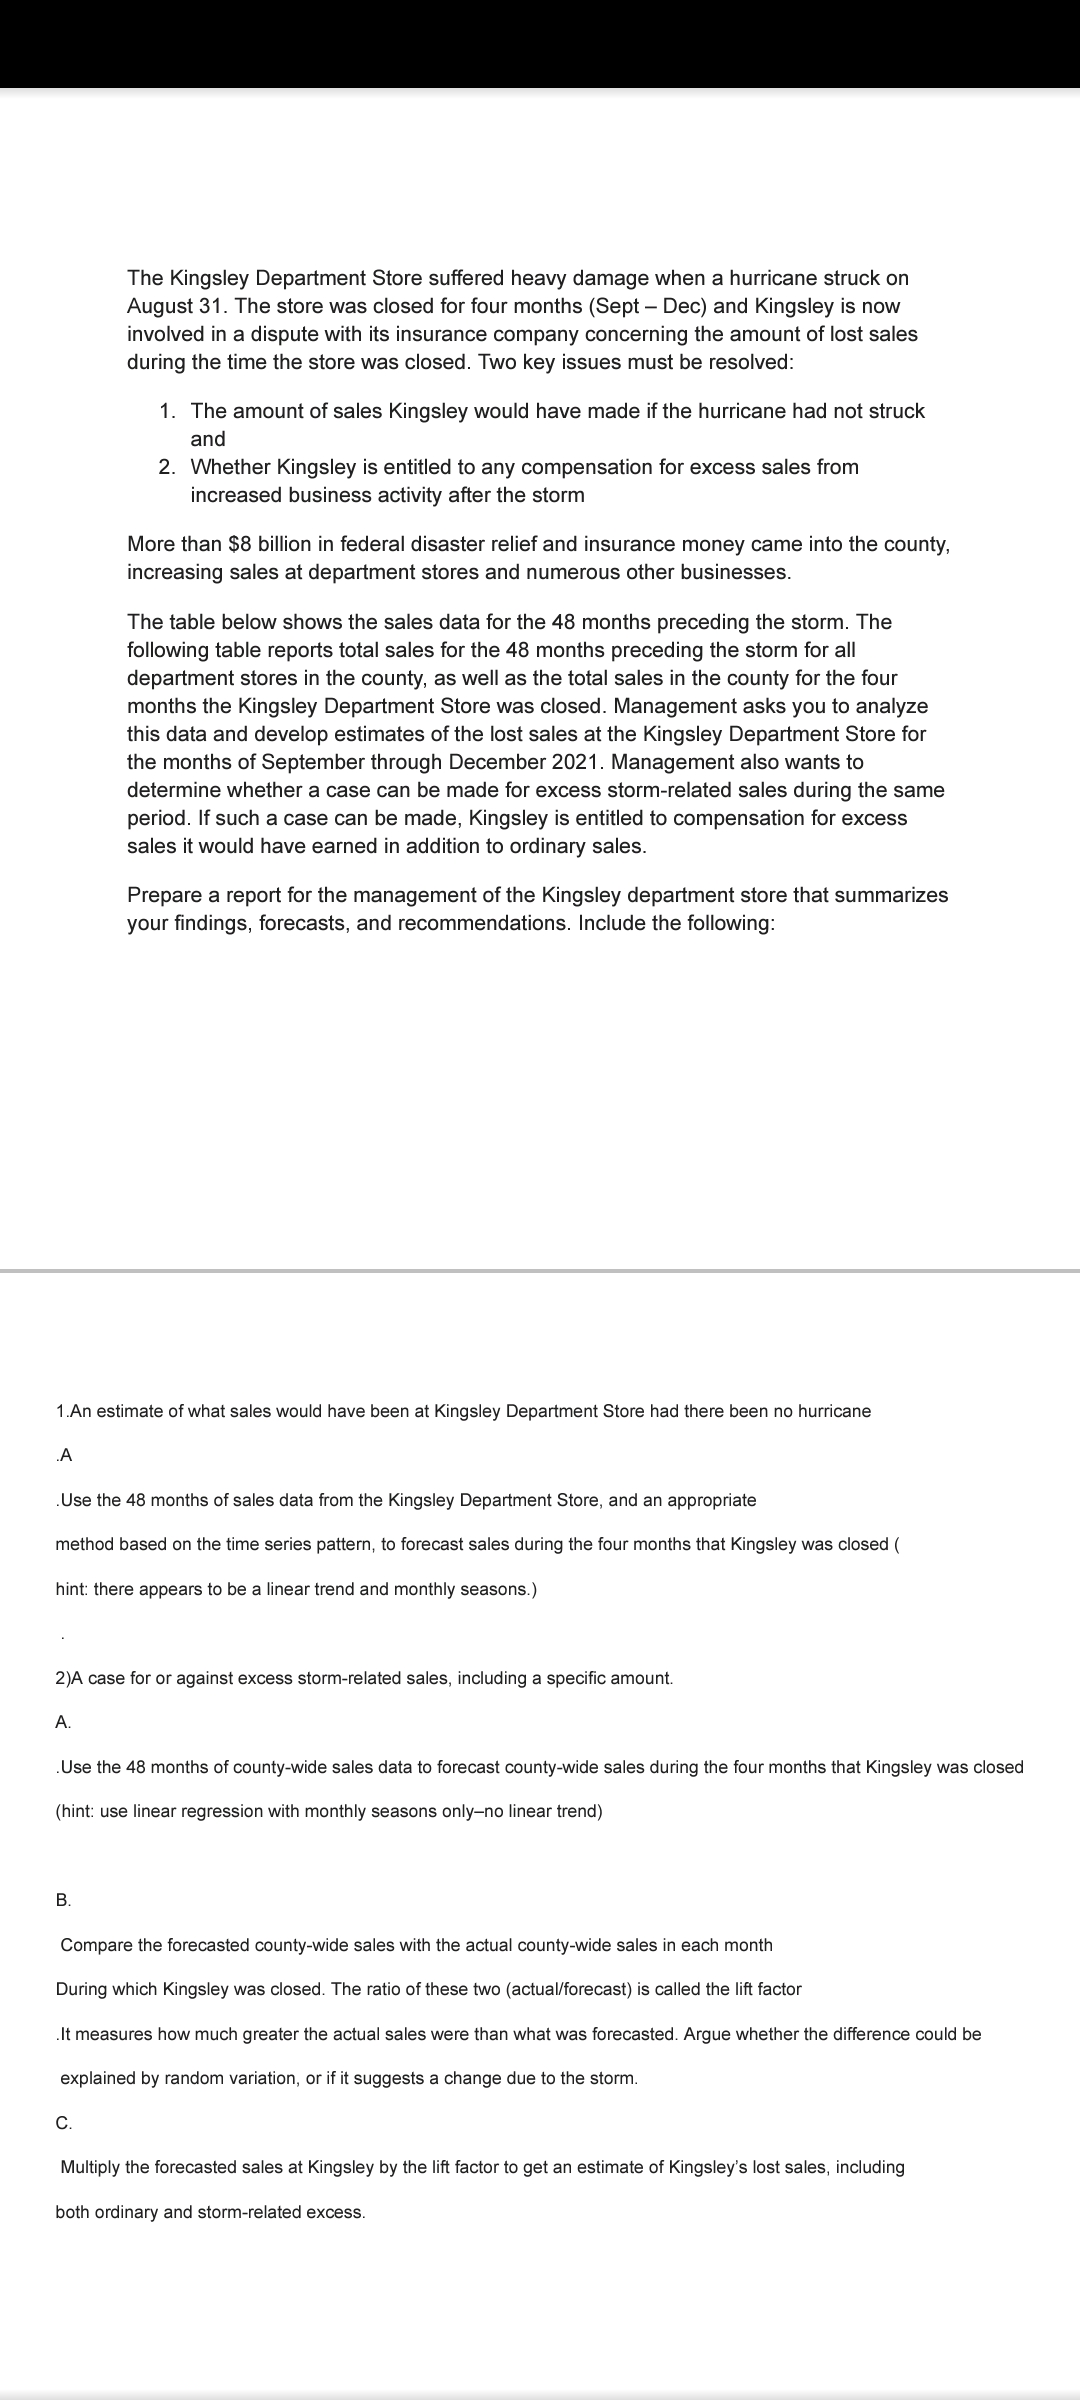
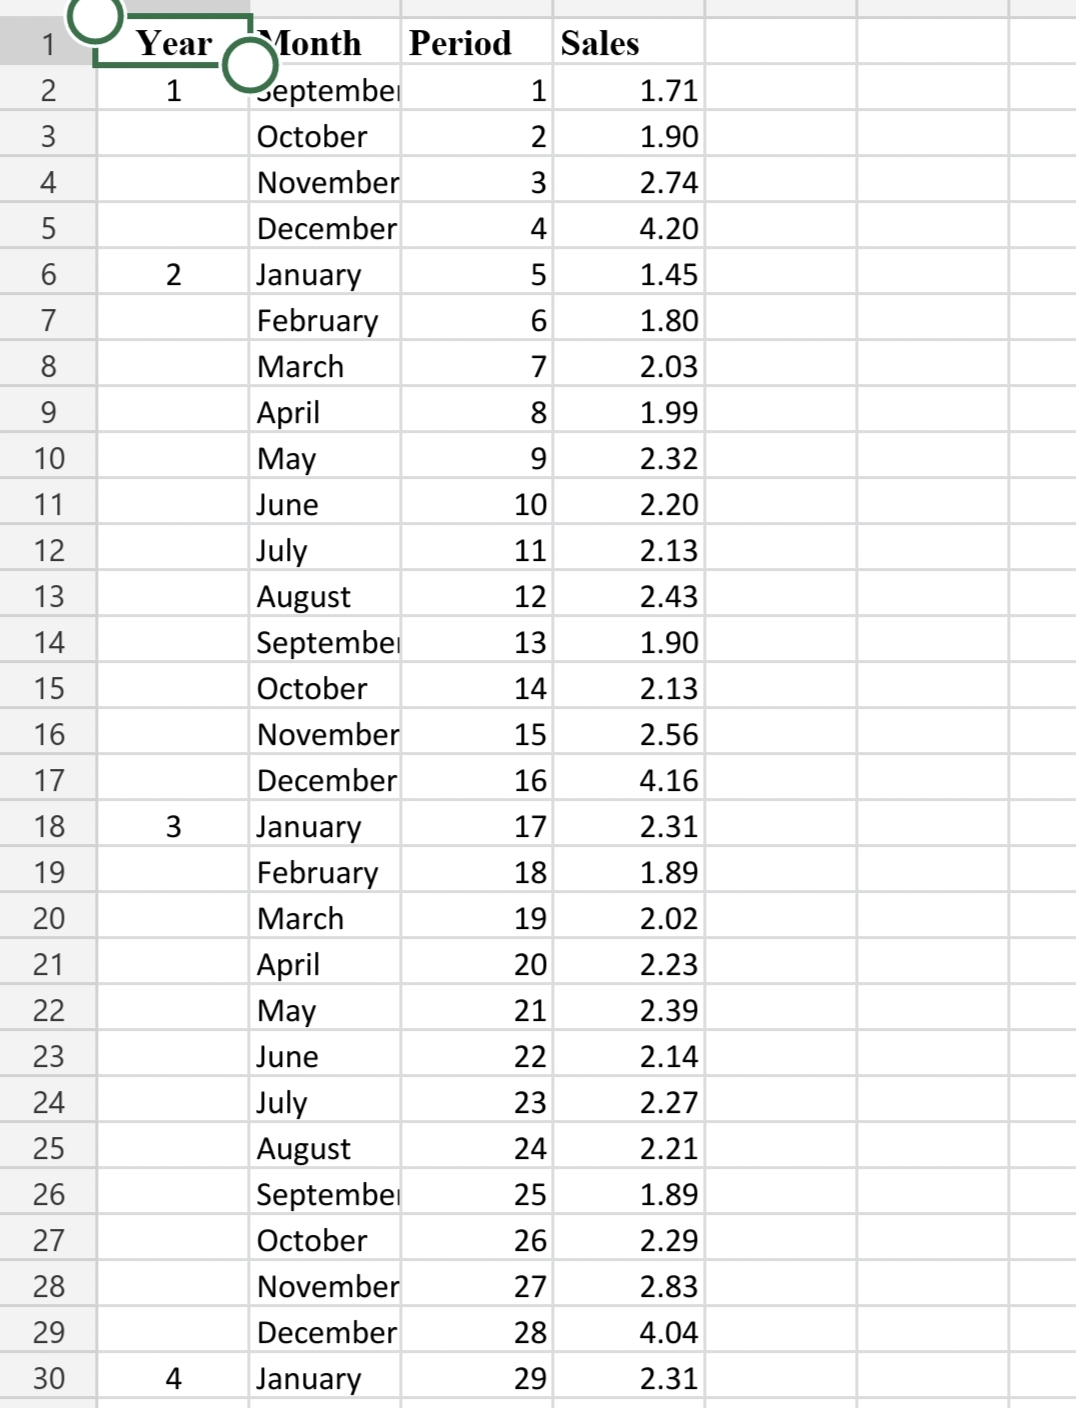
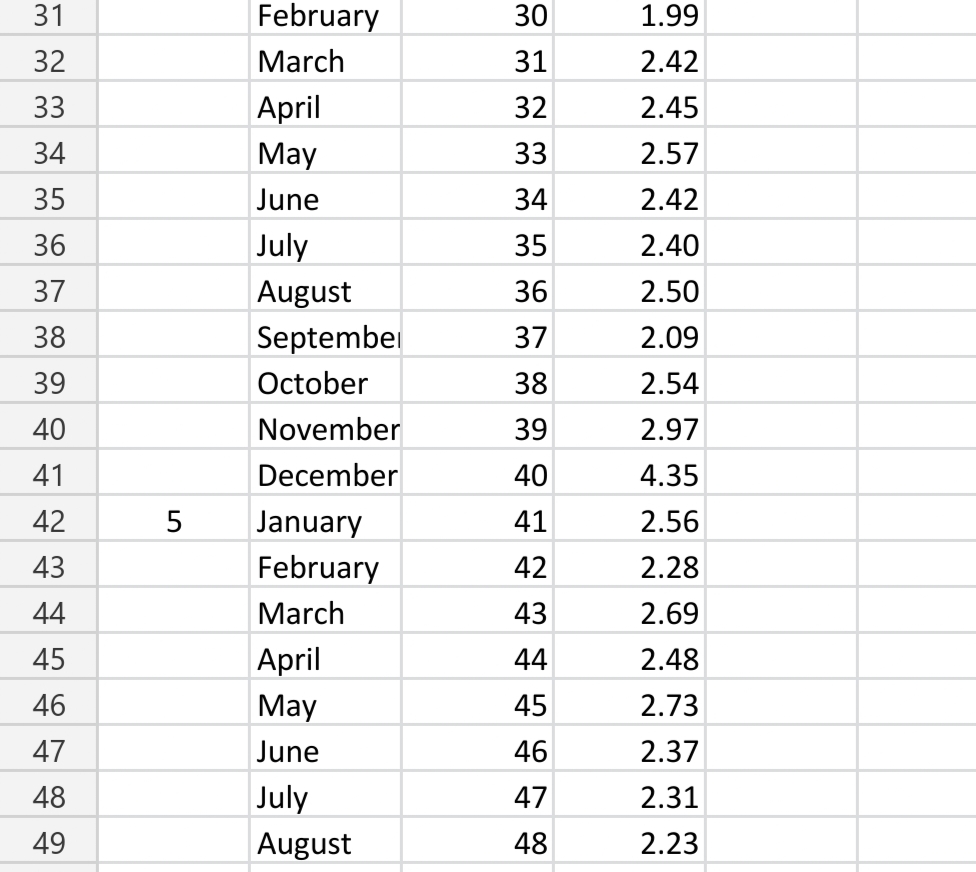
The Kingsley Department Store suffered heavy damage when a hurricane struck on August 31. The store was closed for four months (Sept - Dec) and Kingsley is now involved in a dispute with its insurance company concerning the amount of lost sales during the time the store was closed. Two key issues must be resolved: 1. The amount of sales Kingsley would have made if the hurricane had not struck and 2. Whether Kingsley is entitled to any compensation for excess sales from increased business activity after the storm More than $8 billion in federal disaster relief and insurance money came into the county, increasing sales at department stores and numerous other businesses. The table below shows the sales data for the 48 months preceding the storm. The following table reports total sales for the 48 months preceding the storm for all department stores in the county, as well as the total sales in the county for the four months the Kingsley Department Store was closed. Management asks you to analyze this data and develop estimates of the lost sales at the Kingsley Department Store for the months of September through December 2021. Management also wants to determine whether a case can be made for excess storm-related sales during the same period. If such a case can be made, Kingsley is entitled to compensation for excess sales it would have earned in addition to ordinary sales. Prepare a report for the management of the Kingsley department store that summarizes your findings, forecasts, and recommendations. Include the following: 1.An estimate of what sales would have been at Kingsley Department Store had there been no hurricane A Use the 48 months of sales data from the Kingsley Department Store, and an appropriate method based on the time series pattern, to forecast sales during the four months that Kingsley was closed ( hint: there appears to be a linear trend and monthly seasons.) 2)A case for or against excess storm-related sales, including a specific amount. A. Use the 48 months of county-wide sales data to forecast county-wide sales during the four months that Kingsley was closed (hint: use linear regression with monthly seasons only-no linear trend) B. Compare the forecasted county-wide sales with the actual county-wide sales in each month During which Kingsley was closed. The ratio of these two (actual/forecast) is called the lift factor It measures how much greater the actual sales were than what was forecasted. Argue whether the difference could be explained by random variation, or if it suggests a change due to the storm. C. Multiply the forecasted sales at Kingsley by the lift factor to get an estimate of Kingsley's lost sales, including both ordinary and storm-related excess. \begin{tabular}{|c|l|l|l|l|} \hline 1 & Year & Tonth & Period & \multicolumn{1}{|c|}{ Sales } \\ \hline 2 & 1 & Septembe & 1 & 1.71 \\ \hline 3 & & October & 2 & 1.90 \\ \hline 4 & & November & 3 & 2.74 \\ \hline 5 & & December & 4 & 4.20 \\ \hline 6 & 2 & January & 5 & 1.45 \\ \hline 7 & & February & 6 & 1.80 \\ \hline 8 & & March & 7 & 2.03 \\ \hline 9 & & April & 8 & 1.99 \\ \hline 10 & & May & 9 & 2.32 \\ \hline 11 & & June & 10 & 2.20 \\ \hline 12 & & July & 11 & 2.13 \\ \hline 13 & & August & 12 & 2.43 \\ \hline 14 & & Septembe & 13 & 1.90 \\ \hline 15 & & October & 14 & 2.13 \\ \hline 16 & & November & 15 & 2.56 \\ \hline 17 & & December & 16 & 4.16 \\ \hline 18 & 3 & January & 17 & 2.31 \\ \hline 19 & & February & 18 & 1.89 \\ \hline 20 & & March & 19 & 2.02 \\ \hline 21 & & April & 20 & 2.23 \\ \hline 22 & & May & 21 & 2.39 \\ \hline 23 & & June & 22 & 2.14 \\ \hline 24 & & July & 23 & 2.27 \\ \hline 25 & & August & 24 & 2.21 \\ \hline 26 & & Septembe & 25 & 1.89 \\ \hline 27 & & October & 26 & 2.29 \\ \hline 28 & & November & 27 & 2.83 \\ \hline 29 & & December & 28 & 4.04 \\ \hline 30 & 4 & January & 29 & 2.31 \\ \hline \end{tabular} \begin{tabular}{|l|l|l|l|l|} \hline 31 & February & 30 & 1.99 \\ \hline 32 & March & 31 & 2.42 \\ \hline 33 & & April & 32 & 2.45 \\ \hline 34 & & May & 33 & 2.57 \\ \hline 35 & & June & 34 & 2.42 \\ \hline 36 & & July & 35 & 2.40 \\ \hline 37 & & August & 36 & 2.50 \\ \hline 38 & & Septembe & 37 & 2.09 \\ \hline 39 & & October & 38 & 2.54 \\ \hline 40 & & November & 39 & 2.97 \\ \hline 41 & & December & 40 & 4.35 \\ \hline 42 & 5 & January & 41 & 2.56 \\ \hline 43 & & February & 42 & 2.28 \\ \hline 44 & & March & 43 & 2.69 \\ \hline 45 & & April & 44 & 2.48 \\ \hline 46 & & May & 45 & 2.73 \\ \hline 47 & & June & 46 & 2.37 \\ \hline 48 & & July & 47 & 2.31 \\ \hline 49 & & August & 48 & 2.23 \\ \hline \end{tabular}
Step by Step Solution
There are 3 Steps involved in it
Step: 1

Get Instant Access to Expert-Tailored Solutions
See step-by-step solutions with expert insights and AI powered tools for academic success
Step: 2

Step: 3
Ace Your Homework with AI
Get the answers you need in no time with our AI-driven, step-by-step assistance
Get Started
Optimization Methods In Finance
Authors: Gerard Cornuejols, Reha Tütüncü
1st Edition
0521861705, 978-0521861700