Answered step by step
Verified Expert Solution
Link Copied!

Question

1 Approved Answer

The last digit of the heights of 57 statistics students were Choose the correct histogram below. obtained as part of an experiment conducted for a
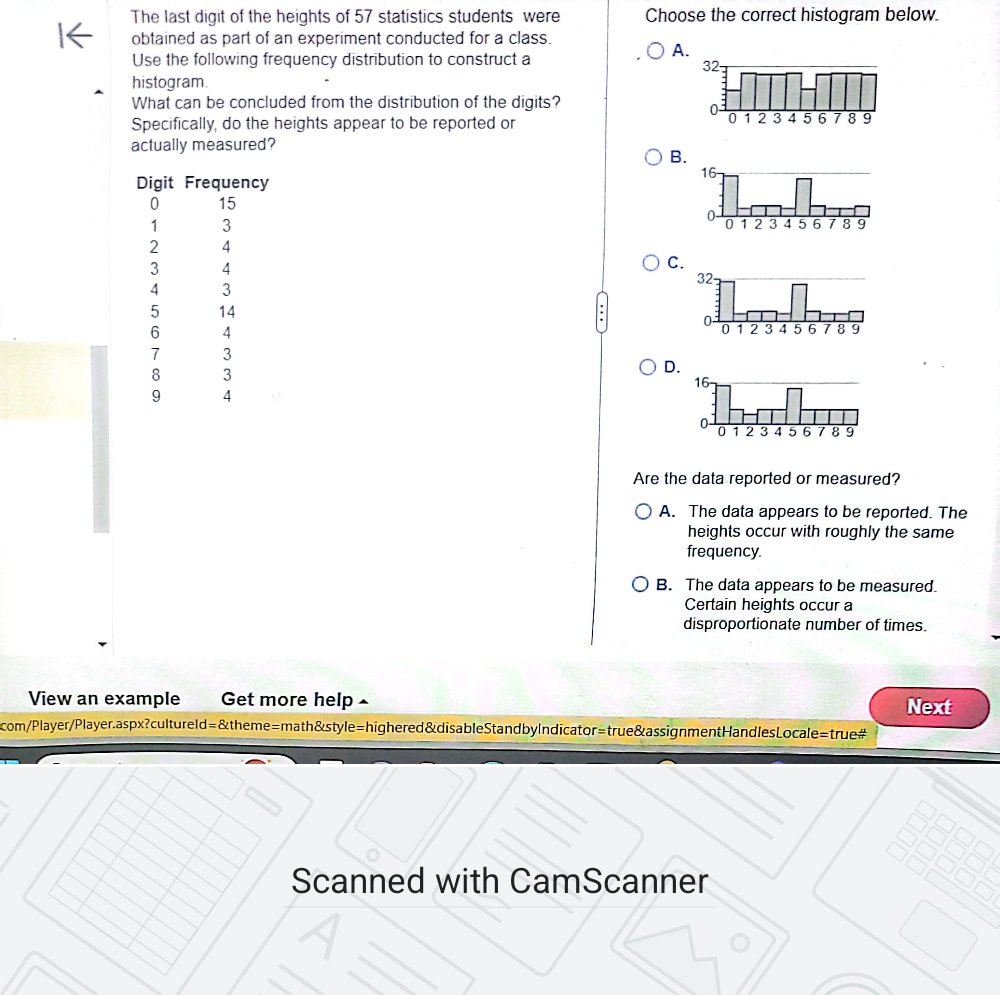
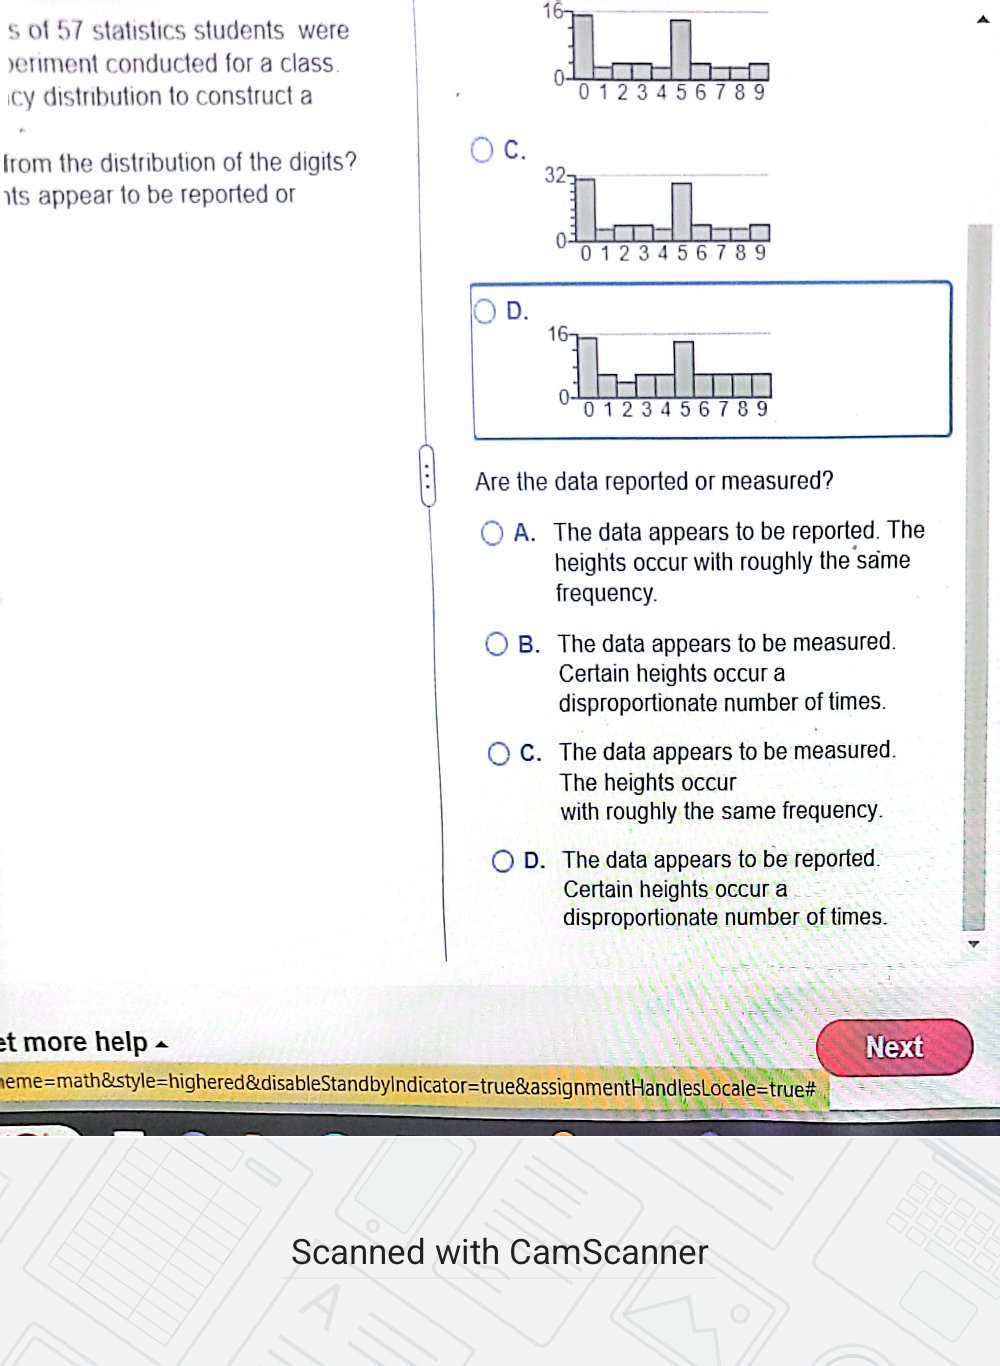
image text in transcribedimage text in transcribed
The last digit of the heights of 57 statistics students were Choose the correct histogram below. obtained as part of an experiment conducted for a class. Use the following frequency distribution to construct a . O A. 327 histogram. What can be concluded from the distribution of the digits? Specifically, do the heights appear to be reported or 012345 6 7 8 9 actually measured? O B. Digit Frequency 0 15 O C. AWWARWADW DO YOUAWN - OD. Are the data reported or measured? O A. The data appears to be reported. The heights occur with roughly the same frequency. O B. The data appears to be measured. Certain heights occur a disproportionate number of times. View an example Get more help - Next com/Player/Player.aspx?cultureld=&theme=math&style=highered&disableStandbyIndicator=true&assignmentHandlesLocale=true# 0000 0000 Scanned with CamScanners of 57 statistics students were eriment conducted for a class cy distribution to construct a 0123456789 from the distribution of the digits? OC. its appear to be reported or 01234 5 6 7 8 9 OD. 0123456789 Are the data reported or measured? O A. The data appears to be reported. The heights occur with roughly the same frequency. O B. The data appears to be measured. Certain heights occur a disproportionate number of times. O C. The data appears to be measured. The heights occur with roughly the same frequency. O D. The data appears to be reported. Certain heights occur a disproportionate number of times. t more help - Next eme=math&style=highered&disableStandbyIndicator=true&assignmentHandlesLocale=true# 0000 0000 1000 Scanned with CamScanner

Step by Step Solution

There are 3 Steps involved in it

Step: 1

blur-text-image

Get Instant Access to Expert-Tailored Solutions

See step-by-step solutions with expert insights and AI powered tools for academic success

Step: 2

blur-text-image

Step: 3

blur-text-image

Ace Your Homework with AI

Get the answers you need in no time with our AI-driven, step-by-step assistance

Get Started

Recommended Textbook for

Elementary Statisitcs

Authors: Barry Monk

2nd edition

1259345297, 978-0077836351, 77836359, 978-1259295911, 1259295915, 978-1259292484, 1259292487, 978-1259345296

More Books

Students also viewed these Mathematics questions

Question

Find the radius and interval of convergence: n ! n 2n x - 3 n=1

Answered: 1 week ago