 the last oicture was the answer for the first part of the project the one I I posted now is for the second part
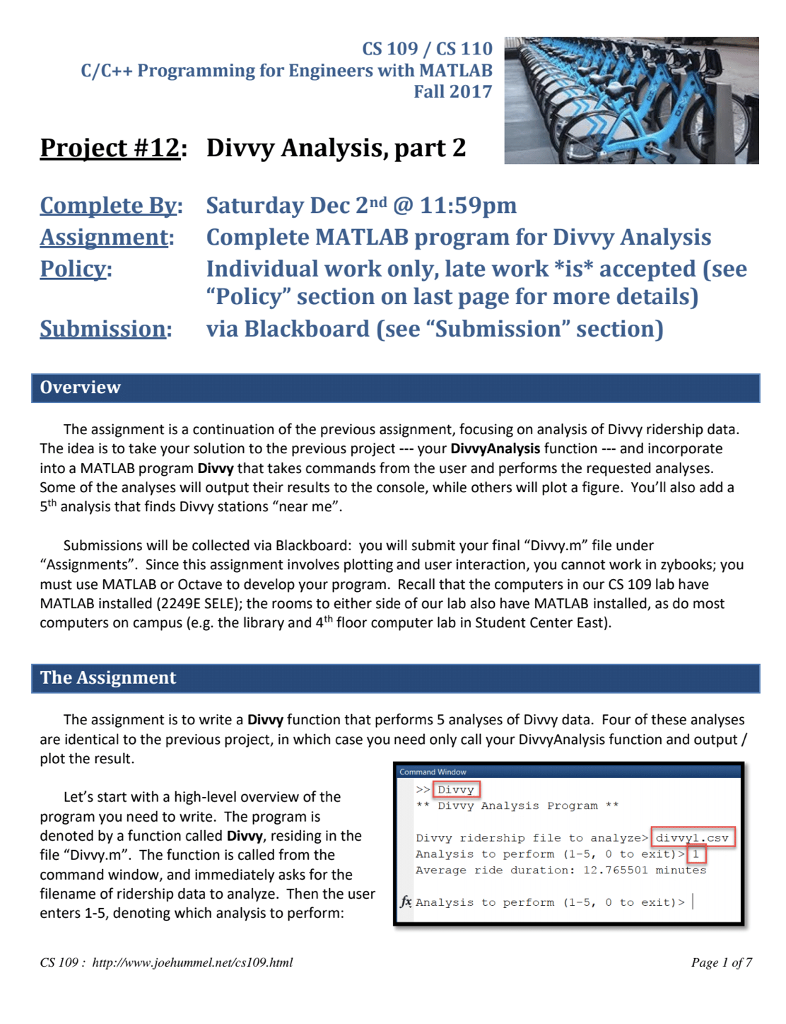
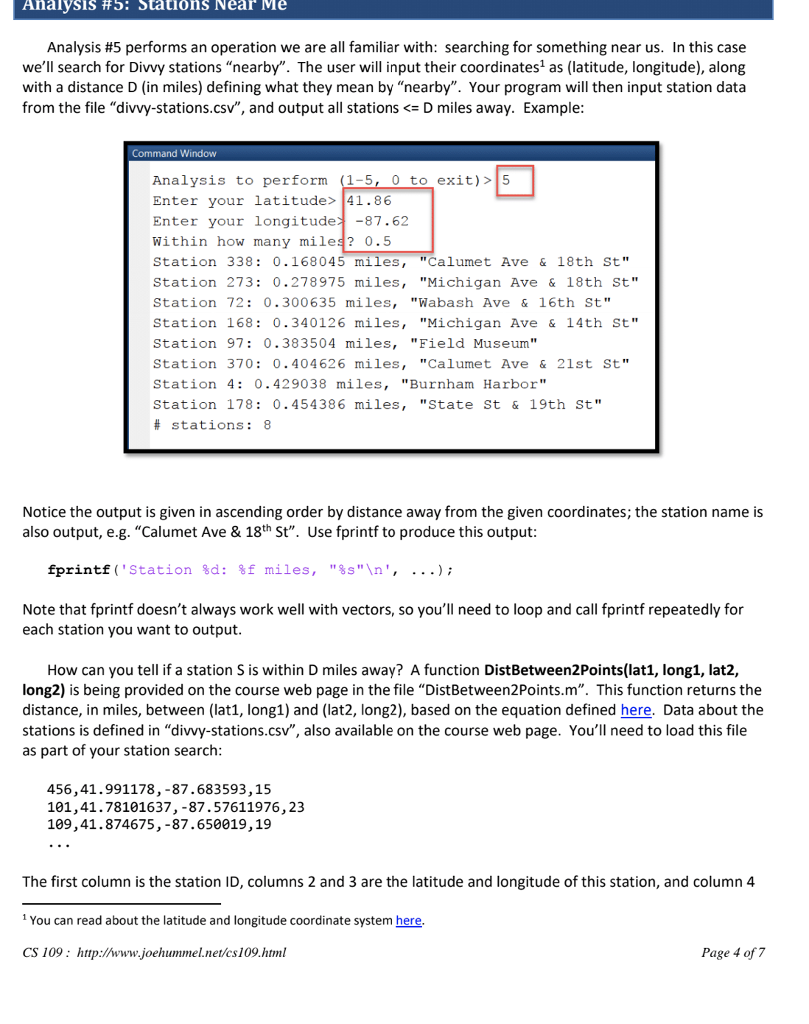
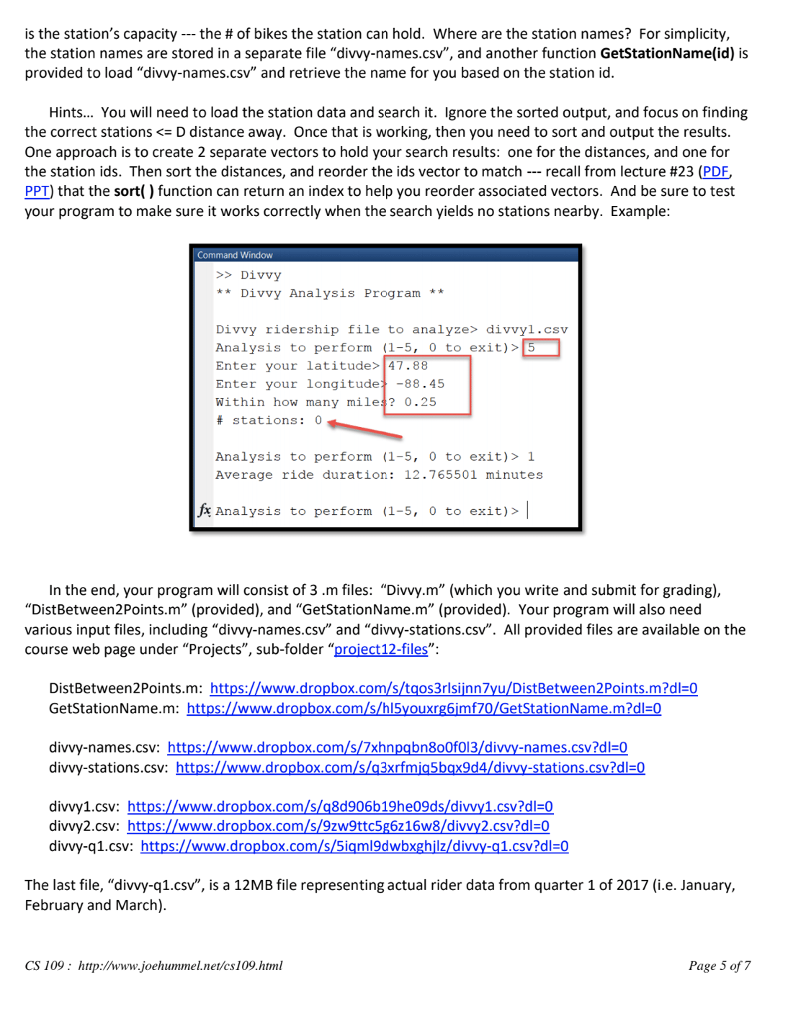
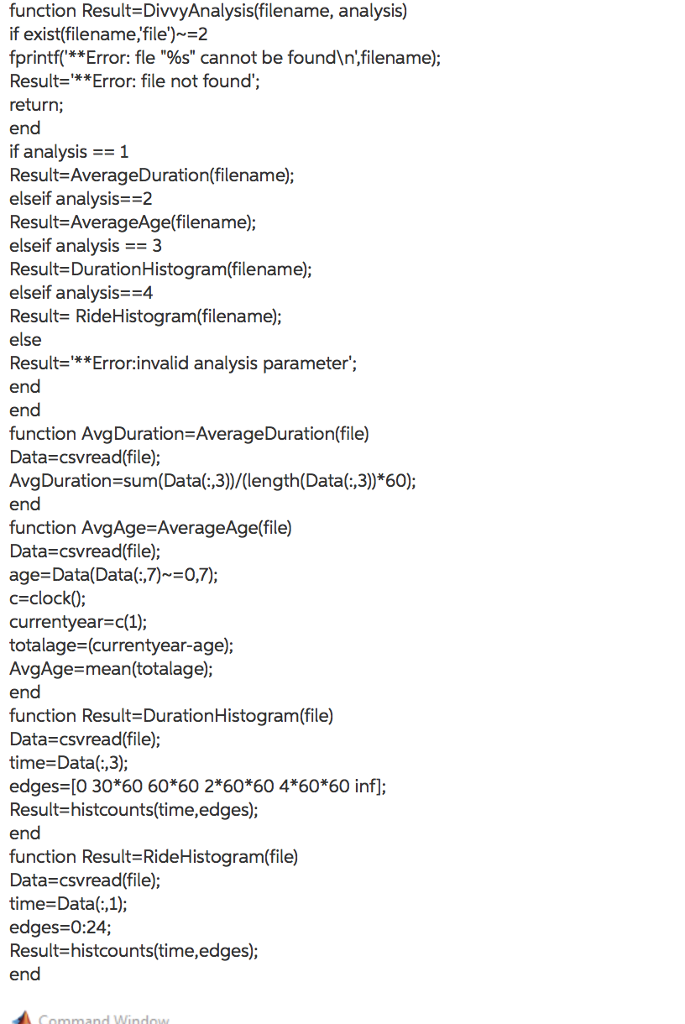
CS 109 / CS 110 C/C++ Programming for Engineers with MATLAB Fall 2017 Project #12: Divvy Analysis, part 2 Complete By: Saturday Dec 2nd @ 11:59pm Assignment Complete MATLAB program for Divvy Analysis Policy Individual work only, late work *is* accepted (see "Policy" section on last page for more details) via Blackboard (see "Submission" section) Submission: Overview The assignment is a continuation of the previous assignment, focusing on analysis of Divvy ridership data The idea is to take your solution to the previous project your DwyAnalysis function and incorporate into a MATLAB program Divvy that takes commands from the user and performs the requested analyses Some of the analyses will output their results to the console, while others will plot a figure. You'll also add a 5th analysis that finds Divvy stations "near me". Submissions will be collected via Blackboard: you will submit your final "Divvy.m" file under "Assignments". Since this assignment involves plotting and user interaction, you cannot work in zybooks; you must use MATLAB or Octave to develop your program. Recall that the computers in our CS 109 lab have MATLAB installed (2249E SELE); the rooms to either side of our lab also have MATLAB installed, as do most computers on campus (e.g. the library and 4th floor computer lab in Student Center East) The Assignment The assignment is to write a Divvy function that performs 5 analyses of Diwy data. Four of these analyses are identical to the previous project, in which case you need only call your DivvyAnalysis function and output / plot the result Di Let's start with a high-level overview of the program you need to write. The program is denoted by a function called Divvy, residing in the file "Divvy.m". The function is called from the command window, and immediately asks for the filename of ridership data to analyze. Then the user enters 1-5, denoting which analysis to perform Divvy Analysis Program Divvy ridership file to analyze divvyl.csv Analysis to perform (1-5, 0 to exit)1 Average ride duration: 12.765501 minutes jxAnalysis to perform (1-5, 0 to exit)> CS 109: http:/www.joehummelnet/cs109.html Page 1 of7 CS 109 / CS 110 C/C++ Programming for Engineers with MATLAB Fall 2017 Project #12: Divvy Analysis, part 2 Complete By: Saturday Dec 2nd @ 11:59pm Assignment Complete MATLAB program for Divvy Analysis Policy Individual work only, late work *is* accepted (see "Policy" section on last page for more details) via Blackboard (see "Submission" section) Submission: Overview The assignment is a continuation of the previous assignment, focusing on analysis of Divvy ridership data The idea is to take your solution to the previous project your DwyAnalysis function and incorporate into a MATLAB program Divvy that takes commands from the user and performs the requested analyses Some of the analyses will output their results to the console, while others will plot a figure. You'll also add a 5th analysis that finds Divvy stations "near me". Submissions will be collected via Blackboard: you will submit your final "Divvy.m" file under "Assignments". Since this assignment involves plotting and user interaction, you cannot work in zybooks; you must use MATLAB or Octave to develop your program. Recall that the computers in our CS 109 lab have MATLAB installed (2249E SELE); the rooms to either side of our lab also have MATLAB installed, as do most computers on campus (e.g. the library and 4th floor computer lab in Student Center East) The Assignment The assignment is to write a Divvy function that performs 5 analyses of Diwy data. Four of these analyses are identical to the previous project, in which case you need only call your DivvyAnalysis function and output / plot the result Di Let's start with a high-level overview of the program you need to write. The program is denoted by a function called Divvy, residing in the file "Divvy.m". The function is called from the command window, and immediately asks for the filename of ridership data to analyze. Then the user enters 1-5, denoting which analysis to perform Divvy Analysis Program Divvy ridership file to analyze divvyl.csv Analysis to perform (1-5, 0 to exit)1 Average ride duration: 12.765501 minutes jxAnalysis to perform (1-5, 0 to exit)> CS 109: http:/www.joehummelnet/cs109.html Page 1 of7