the last photo uses incorrect numbers. Please refer to the 7th photo that reviews all of the requirements! Thank you
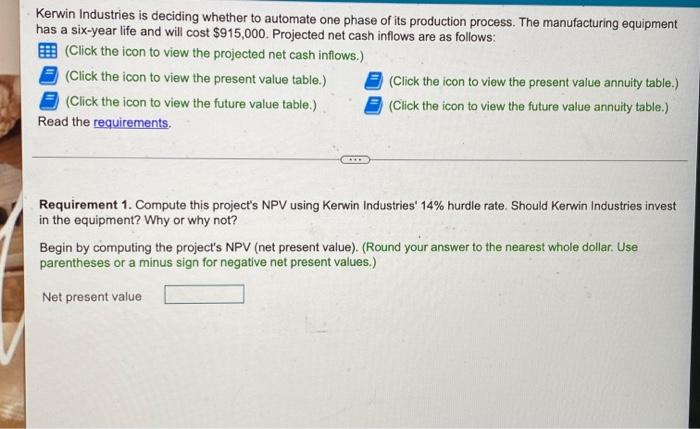
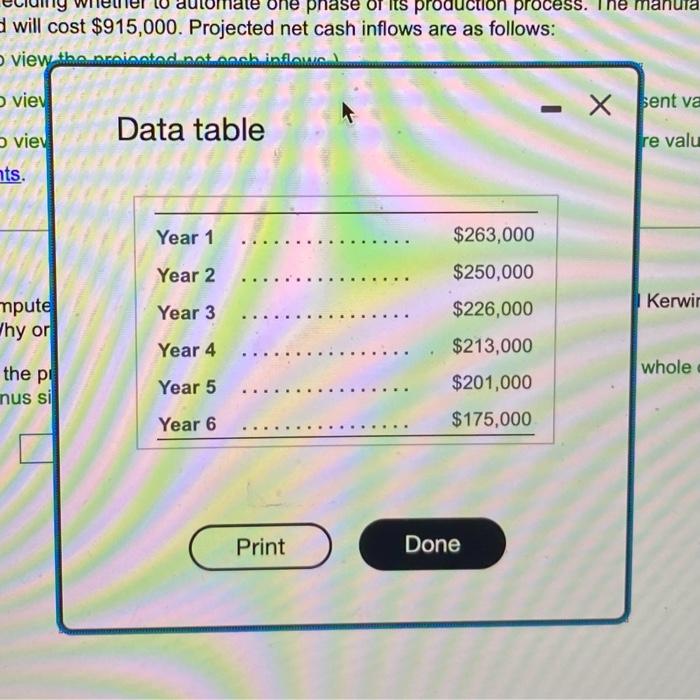
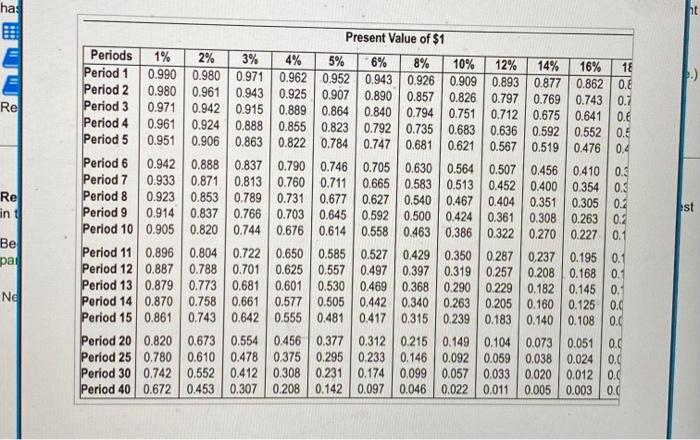
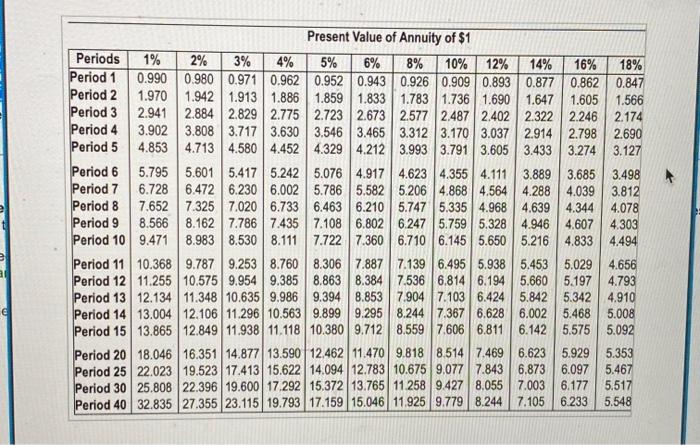
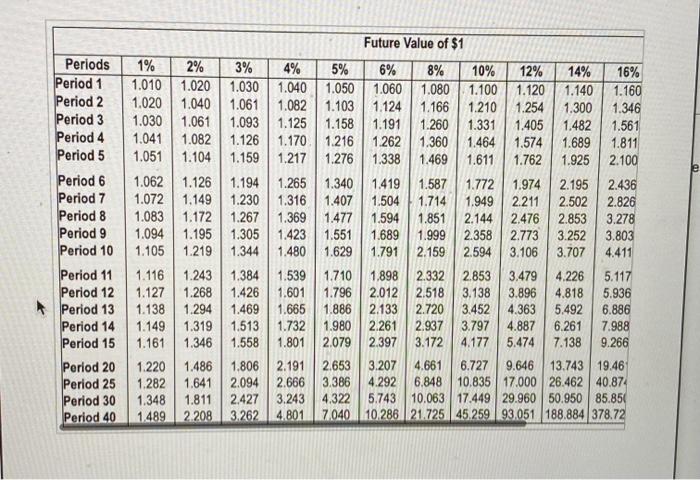
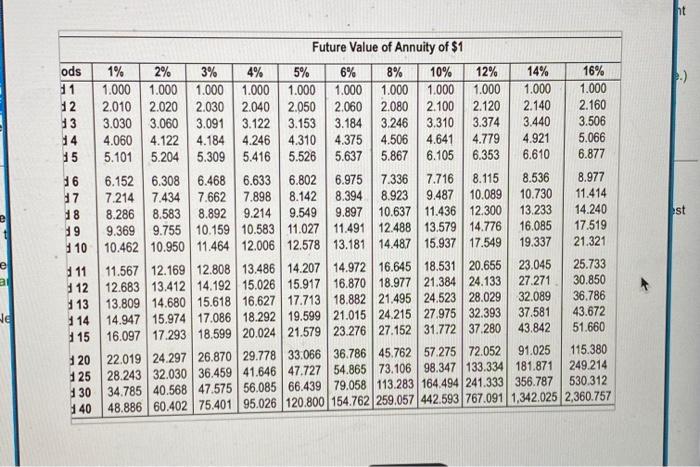
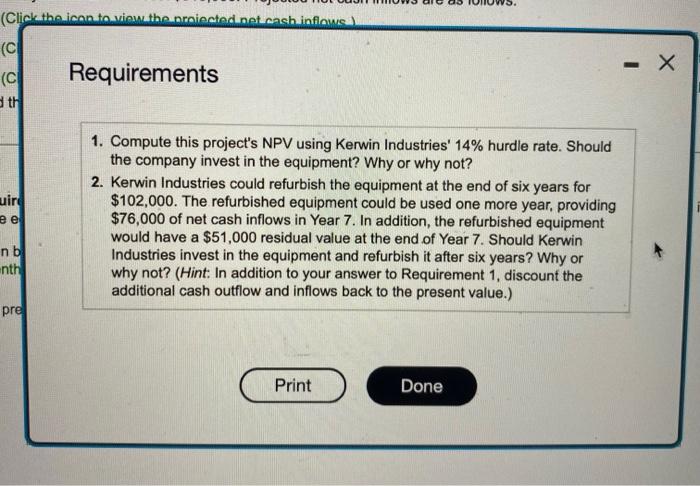
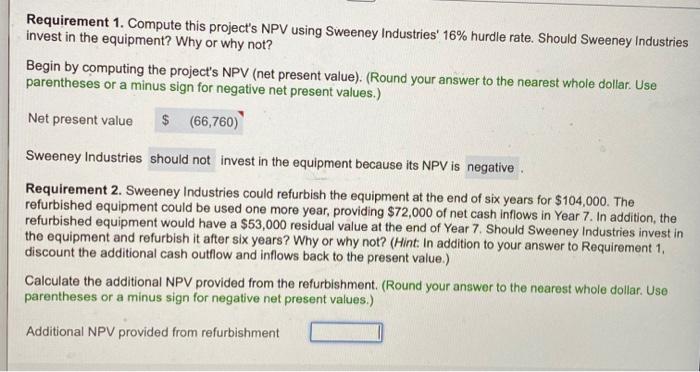
Kerwin Industries is deciding whether to automate one phase of its production process. The manufacturing equipment has a six-year life and will cost $915,000. Projected net cash inflows are as follows: (Click the icon to view the projected net cash inflows.) (Click the icon to view the present value table.) (Click the icon to view the present value annuity table.) (Click the icon to view the future value table.) (Click the icon to view the future value annuity table.) Read the requirements. Requirement 1. Compute this project's NPV using Kerwin Industries' 14% hurdle rate. Should Kerwin Industries invest in the equipment? Why or why not? Begin by computing the project's NPV (net present value). (Round your answer to the nearest whole dollar. Use parentheses or a minus sign for negative net present values.) Net present value will cost $915,000. Projected net cash inflows are as follows: Present Value of $1 \begin{tabular}{|l|c|c|c|c|c|c|c|c|c|c|c|c|} \hline Periods & 1% & 2% & 3% & 4% & 5% & 6% & 8% & 10% & 12% & 14% & 16% & 1 \\ \hline Period 1 & 0.990 & 0.980 & 0.971 & 0.962 & 0.952 & 0.943 & 0.926 & 0.909 & 0.893 & 0.877 & 0.862 & 0.8 \\ Period 2 & 0.980 & 0.961 & 0.943 & 0.925 & 0.907 & 0.890 & 0.857 & 0.826 & 0.797 & 0.769 & 0.743 & 0.7 \\ Period 3 & 0.971 & 0.942 & 0.915 & 0.889 & 0.864 & 0.840 & 0.794 & 0.751 & 0.712 & 0.675 & 0.641 & 0.6 \\ Period 4 & 0.961 & 0.924 & 0.888 & 0.855 & 0.823 & 0.792 & 0.735 & 0.683 & 0.636 & 0.592 & 0.552 & 0.5 \\ Period 5 & 0.951 & 0.906 & 0.863 & 0.822 & 0.784 & 0.747 & 0.681 & 0.621 & 0.567 & 0.519 & 0.476 & 0.5 \\ Period 6 & 0.942 & 0.888 & 0.837 & 0.790 & 0.746 & 0.705 & 0.630 & 0.564 & 0.507 & 0.456 & 0.410 & 0.3 \\ Period 7 & 0.933 & 0.871 & 0.813 & 0.760 & 0.711 & 0.665 & 0.583 & 0.513 & 0.452 & 0.400 & 0.354 & 0.3 \\ Period 8 & 0.923 & 0.853 & 0.789 & 0.731 & 0.677 & 0.627 & 0.540 & 0.467 & 0.404 & 0.351 & 0.305 & 0.3 \\ Period 9 & 0.914 & 0.837 & 0.766 & 0.703 & 0.645 & 0.592 & 0.500 & 0.424 & 0.361 & 0.308 & 0.263 & 0.2 \\ Period 10 & 0.905 & 0.820 & 0.744 & 0.676 & 0.614 & 0.558 & 0.463 & 0.386 & 0.322 & 0.270 & 0.227 & 0.1 \\ Period 11 & 0.896 & 0.804 & 0.722 & 0.650 & 0.585 & 0.527 & 0.429 & 0.350 & 0.287 & 0.237 & 0.195 & 0.1 \\ Period 12 & 0.887 & 0.788 & 0.701 & 0.625 & 0.557 & 0.497 & 0.397 & 0.319 & 0.257 & 0.208 & 0.168 & 0.1 \\ Period 13 & 0.879 & 0.773 & 0.681 & 0.601 & 0.530 & 0.469 & 0.368 & 0.290 & 0.229 & 0.182 & 0.145 & 0.1 \\ Period 14 & 0.870 & 0.758 & 0.661 & 0.577 & 0.505 & 0.442 & 0.340 & 0.263 & 0.205 & 0.160 & 0.125 & 0.0 \\ Period 15 & 0.861 & 0.743 & 0.642 & 0.555 & 0.481 & 0.417 & 0.315 & 0.239 & 0.183 & 0.140 & 0.108 & 0.5 \\ Period 20 & 0.820 & 0.673 & 0.554 & 0.456 & 0.377 & 0.312 & 0.215 & 0.149 & 0.104 & 0.073 & 0.051 & 0.0 \\ Period 25 & 0.780 & 0.610 & 0.478 & 0.375 & 0.295 & 0.233 & 0.146 & 0.092 & 0.059 & 0.038 & 0.024 & 0.6 \\ Perio \end{tabular} Present Value of Annuity of $1 \begin{tabular}{|l|c|c|c|c|c|c|c|c|c|c|c|c|} \hline Periods & 1% & 2% & 3% & 4% & 5% & 6% & 8% & 10% & 12% & 14% & 16% & 18% \\ \hline Period 1 & 0.990 & 0.980 & 0.971 & 0.962 & 0.952 & 0.943 & 0.926 & 0.909 & 0.893 & 0.877 & 0.862 & 0.847 \\ Period 2 & 1.970 & 1.942 & 1.913 & 1.886 & 1.859 & 1.833 & 1.783 & 1.736 & 1.690 & 1.647 & 1.605 & 1.566 \\ Period 3 & 2.941 & 2.884 & 2.829 & 2.775 & 2.723 & 2.673 & 2.577 & 2.487 & 2.402 & 2.322 & 2.246 & 2.174 \\ Period 4 & 3.902 & 3.808 & 3.717 & 3.630 & 3.546 & 3.465 & 3.312 & 3.170 & 3.037 & 2.914 & 2.798 & 2.690 \\ Period 5 & 4.853 & 4.713 & 4.580 & 4.452 & 4.329 & 4.212 & 3.993 & 3.791 & 3.605 & 3.433 & 3.274 & 3.127 \\ Period 6 & 5.795 & 5.601 & 5.417 & 5.242 & 5.076 & 4.917 & 4.623 & 4.355 & 4.111 & 3.889 & 3.685 & 3.498 \\ Period 7 & 6.728 & 6.472 & 6.230 & 6.002 & 5.786 & 5.582 & 5.206 & 4.868 & 4.564 & 4.288 & 4.039 & 3.812 \\ Period 8 & 7.652 & 7.325 & 7.020 & 6.733 & 6.463 & 6.210 & 5.747 & 5.335 & 4.968 & 4.639 & 4.344 & 4.078 \\ Period 9 & 8.566 & 8.162 & 7.786 & 7.435 & 7.108 & 6.802 & 6.247 & 5.759 & 5.328 & 4.946 & 4.607 & 4.303 \\ Period 10 & 9.471 & 8.983 & 8.530 & 8.111 & 7.722 & 7.360 & 6.710 & 6.145 & 5.650 & 5.216 & 4.833 & 4.494 \\ Period 11 & 10.368 & 9.787 & 9.253 & 8.760 & 8.306 & 7.887 & 7.139 & 6.495 & 5.938 & 5.453 & 5.029 & 4.656 \\ Period 12 & 11.255 & 10.575 & 9.954 & 9.385 & 8.863 & 8.384 & 7.536 & 6.814 & 6.194 & 5.660 & 5.197 & 4.793 \\ Period 13 & 12.134 & 11.348 & 10.635 & 9.986 & 9.394 & 8.853 & 7.904 & 7.103 & 6.424 & 5.842 & 5.342 & 4.910 \\ Period 14 & 13.004 & 12.106 & 11.296 & 10.563 & 9.899 & 9.295 & 8.244 & 7.367 & 6.628 & 6.002 & 5.468 & 5.008 \\ Period 15 & 13.865 & 12.849 & 11.938 & 11.118 & 10.380 & 9.712 & 8.559 & 7.606 & 6.811 & 6.142 & 5.575 & 5.092 \\ Period 20 & 18.046 & 16.351 & 14.877 & 13.590 & 12.462 & 11.470 & 9.818 & 8.514 & 7.469 & 6.623 & 5.929 & 5.353 \\ Period 25 & 22.023 & 19.523 & 17.413 & 15.622 & 14.094 & 12. \end{tabular} \begin{tabular}{|l|c|c|c|c|c|c|c|c|c|c|c|} \hline Periods & 1% & 2% & 3% & 4% & 5% & 6% & 8% & 10% & 12% & 14% & 16% \\ \hline Period 1 & 1.010 & 1.020 & 1.030 & 1.040 & 1.050 & 1.060 & 1.080 & 1.100 & 1.120 & 1.140 & 1.160 \\ \hline Period 2 & 1.020 & 1.040 & 1.061 & 1.082 & 1.103 & 1.124 & 1.166 & 1.210 & 1.254 & 1.300 & 1.346 \\ Period 3 & 1.030 & 1.061 & 1.093 & 1.125 & 1.158 & 1.191 & 1.260 & 1.331 & 1.405 & 1.482 & 1.561 \\ \hline Period 4 & 1.041 & 1.082 & 1.126 & 1.170 & 1.216 & 1.262 & 1.360 & 1.464 & 1.574 & 1.689 & 1.811 \\ Period 5 & 1.051 & 1.104 & 1.159 & 1.217 & 1.276 & 1.338 & 1.469 & 1.611 & 1.762 & 1.925 & 2.100 \\ Period 6 & 1.062 & 1.126 & 1.194 & 1.265 & 1.340 & 1.419 & 1.587 & 1.772 & 1.974 & 2.195 & 2.436 \\ Period 7 & 1.072 & 1.149 & 1.230 & 1.316 & 1.407 & 1.504 & 1.714 & 1.949 & 2.211 & 2.502 & 2.826 \\ Period 8 & 1.083 & 1.172 & 1.267 & 1.369 & 1.477 & 1.594 & 1.851 & 2.144 & 2.476 & 2.853 & 3.278 \\ Period 9 & 1.094 & 1.195 & 1.305 & 1.423 & 1.551 & 1.689 & 1.999 & 2.358 & 2.773 & 3.252 & 3.803 \\ Period 10 & 1.105 & 1.219 & 1.344 & 1.480 & 1.629 & 1.791 & 2.159 & 2.594 & 3.106 & 3.707 & 4.411 \\ Period 11 & 1.116 & 1.243 & 1.384 & 1.539 & 1.710 & 1.898 & 2.332 & 2.853 & 3.479 & 4.226 & 5.117 \\ Period 12 & 1.127 & 1.268 & 1.426 & 1.601 & 1.796 & 2.012 & 2.518 & 3.138 & 3.896 & 4.818 & 5.936 \\ Period 13 & 1.138 & 1.294 & 1.469 & 1.665 & 1.886 & 2.133 & 2.720 & 3.452 & 4.363 & 5.492 & 6.886 \\ Period 14 & 1.149 & 1.319 & 1.513 & 1.732 & 1.980 & 2.261 & 2.937 & 3.797 & 4.887 & 6.261 & 7.988 \\ Period 15 & 1.161 & 1.346 & 1.558 & 1.801 & 2.079 & 2.397 & 3.172 & 4.177 & 5.474 & 7.138 & 9.266 \\ Period 20 & 1.220 & 1.486 & 1.806 & 2.191 & 2.653 & 3.207 & 4.661 & 6.727 & 9.646 & 13.743 & 19.46 \\ Period 25 & 1.282 & 1.641 & 2.094 & 2.666 & 3.386 & 4.292 & 6.848 & 10.835 & 17.000 & 26.462 & 40.876 \\ Period 30 & 1.348 & 1.811 & 2.427 & 3.243 & 4.322 & 5.743 & 10.063 & 17.449 & 29.960 & 50.950 & 85.856 \end{tabular} Future Value of Annuity of $1 \begin{tabular}{|c|c|c|c|c|c|c|c|c|c|c|c|} \hline ods & 1% & 2% & 3% & 4% & 5% & 6% & 8% & 10% & 12% & 14% & 16% \\ \hlined1 & 1.000 & 1.000 & 1.000 & 1.000 & 1.000 & 1.000 & 1.000 & 1.000 & 1.000 & 1.000 & 1.000 \\ 12 & 2.010 & 2.020 & 2.030 & 2.040 & 2.050 & 2.060 & 2.080 & 2.100 & 2.120 & 2.140 & 2.160 \\ 13 & 3.030 & 3.060 & 3.091 & 3.122 & 3.153 & 3.184 & 3.246 & 3.310 & 3.374 & 3.440 & 3.506 \\ 14 & 4.060 & 4.122 & 4.184 & 4.246 & 4.310 & 4.375 & 4.506 & 4.641 & 4.779 & 4.921 & 5.066 \\ 15 & 5.101 & 5.204 & 5.309 & 5.416 & 5.526 & 5.637 & 5.867 & 6.105 & 6.353 & 6.610 & 6.877 \\ 16 & 6.152 & 6.308 & 6.468 & 6.633 & 6.802 & 6.975 & 7.336 & 7.716 & 8.115 & 8.536 & 8.977 \\ 17 & 7.214 & 7.434 & 7.662 & 7.898 & 8.142 & 8.394 & 8.923 & 9.487 & 10.089 & 10.730 & 11.414 \\ 18 & 8.286 & 8.583 & 8.892 & 9.214 & 9.549 & 9.897 & 10.637 & 11.436 & 12.300 & 13.233 & 14.240 \\ 19 & 9.369 & 9.755 & 10.159 & 10.583 & 11.027 & 11.491 & 12.488 & 13.579 & 14.776 & 16.085 & 17.519 \\ 110 & 10.462 & 10.950 & 11.464 & 12.006 & 12.578 & 13.181 & 14.487 & 15.937 & 17.549 & 19.337 & 21.321 \\ 111 & 11.567 & 12.169 & 12.808 & 13.486 & 14.207 & 14.972 & 16.645 & 18.531 & 20.655 & 23.045 & 25.733 \\ 112 & 12.683 & 13.412 & 14.192 & 15.026 & 15.917 & 16.870 & 18.977 & 21.384 & 24.133 & 27.271 & 30.850 \\ 113 & 13.809 & 14.680 & 15.618 & 16.627 & 17.713 & 18.882 & 21.495 & 24.523 & 28.029 & 32.089 & 36.786 \\ 114 & 14.947 & 15.974 & 17.086 & 18.292 & 19.599 & 21.015 & 24.215 & 27.975 & 32.393 & 37.581 & 43.672 \\ 115 & 16.097 & 17.293 & 18.599 & 20.024 & 21.579 & 23.276 & 27.152 & 31.772 & 37.280 & 43.842 & 51.660 \\ 120 & 22.019 & 24.297 & 26.870 & 29.778 & 33.066 & 36.786 & 45.762 & 57.275 & 72.052 & 91.025 & 115.380 \\ 125 & 28.243 & 32.030 & 36.459 & 41.646 & 47.727 & 54.865 & 73.106 & 98.347 & 133.334 & 181.871 & 249.214 \\ 130 & 34.785 & 40.568 & 47.575 & 56.085 & 66.439 & 79.058 & 113.283 & 164.494 & 241.333 & 356.787 & 530.312 \\ 140 & 48.886 & 60.402 & 75.401 & 95.026 & 120.800 & 154.762 & 259.057 & 442.593 & 767.091 \end{tabular} 3.) Requirements 1. Compute this project's NPV using Kerwin Industries' 14% hurdle rate. Should the company invest in the equipment? Why or why not? 2. Kerwin Industries could refurbish the equipment at the end of six years for $102,000. The refurbished equipment could be used one more year, providing $76,000 of net cash inflows in Year 7 . In addition, the refurbished equipment would have a $51,000 residual value at the end of Year 7 . Should Kerwin Industries invest in the equipment and refurbish it after six years? Why or why not? (Hint: In addition to your answer to Requirement 1 , discount the additional cash outflow and inflows back to the present value.) Requirement 1. Compute this project's NPV using Sweeney Industries' 16% hurdle rate. Should Sweeney Industries invest in the equipment? Why or why not? Begin by computing the project's NPV (net present value). (Round your answer to the nearest whole dollar. Use parentheses or a minus sign for negative net present values.) Net present value Sweeney Industries invest in the equipment because its NPV is Requirement 2. Sweeney Industries could refurbish the equipment at the end of six years for $104,000. The refurbished equipment could be used one more year, providing $72,000 of net cash inflows in Year 7 . In addition, the refurbished equipment would have a $53,000 residual value at the end of Year 7 . Should Sweeney Industries invest in the equipment and refurbish it after six years? Why or why not? (Hint: In addition to your answer to Requirement 1 , discount the additional cash outflow and inflows back to the present value.) Calculate the additional NPV provided from the refurbishment. (Round your answer to the nearest whole dollar. Use parentheses or a minus sign for negative net present values.) Additional NPV provided from refurbishment


