

Question
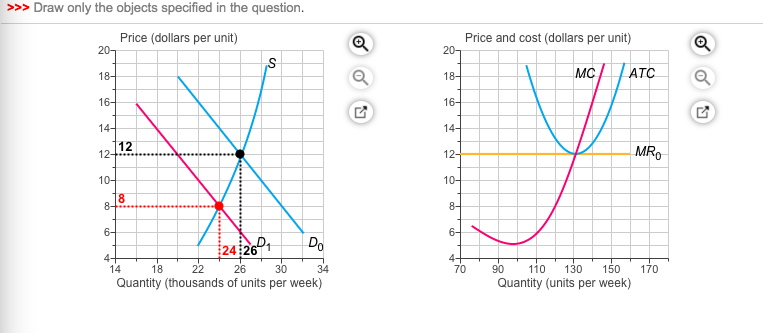
The left graph shows a perfectly competitive market. Demand decreases and the demand curve shifts leftward from D 0 to D 1. The right graph
The left graph shows a perfectly competitive market. Demand decreases and the demand curve shifts leftward from
D0 to D1. The right graph shows the cost curves and the marginal revenue curve of an individual firm when demand is D0.
???
In the right?graph, draw the new MR curve when demand decreases to D1. Label it.
Draw a point to show the new price and the new quantity the firm produces.
???
Draw a shape that shows the?firm's economic loss. Label it.
Step by Step Solution
There are 3 Steps involved in it
Step: 1

Get Instant Access to Expert-Tailored Solutions
See step-by-step solutions with expert insights and AI powered tools for academic success
Step: 2

Step: 3
Ace Your Homework with AI
Get the answers you need in no time with our AI-driven, step-by-step assistance
Get Started
Managerial economics
Authors: william f. samuelson stephen g. marks
7th edition
9781118214183, 1118041585, 1118214188, 978-1118041581