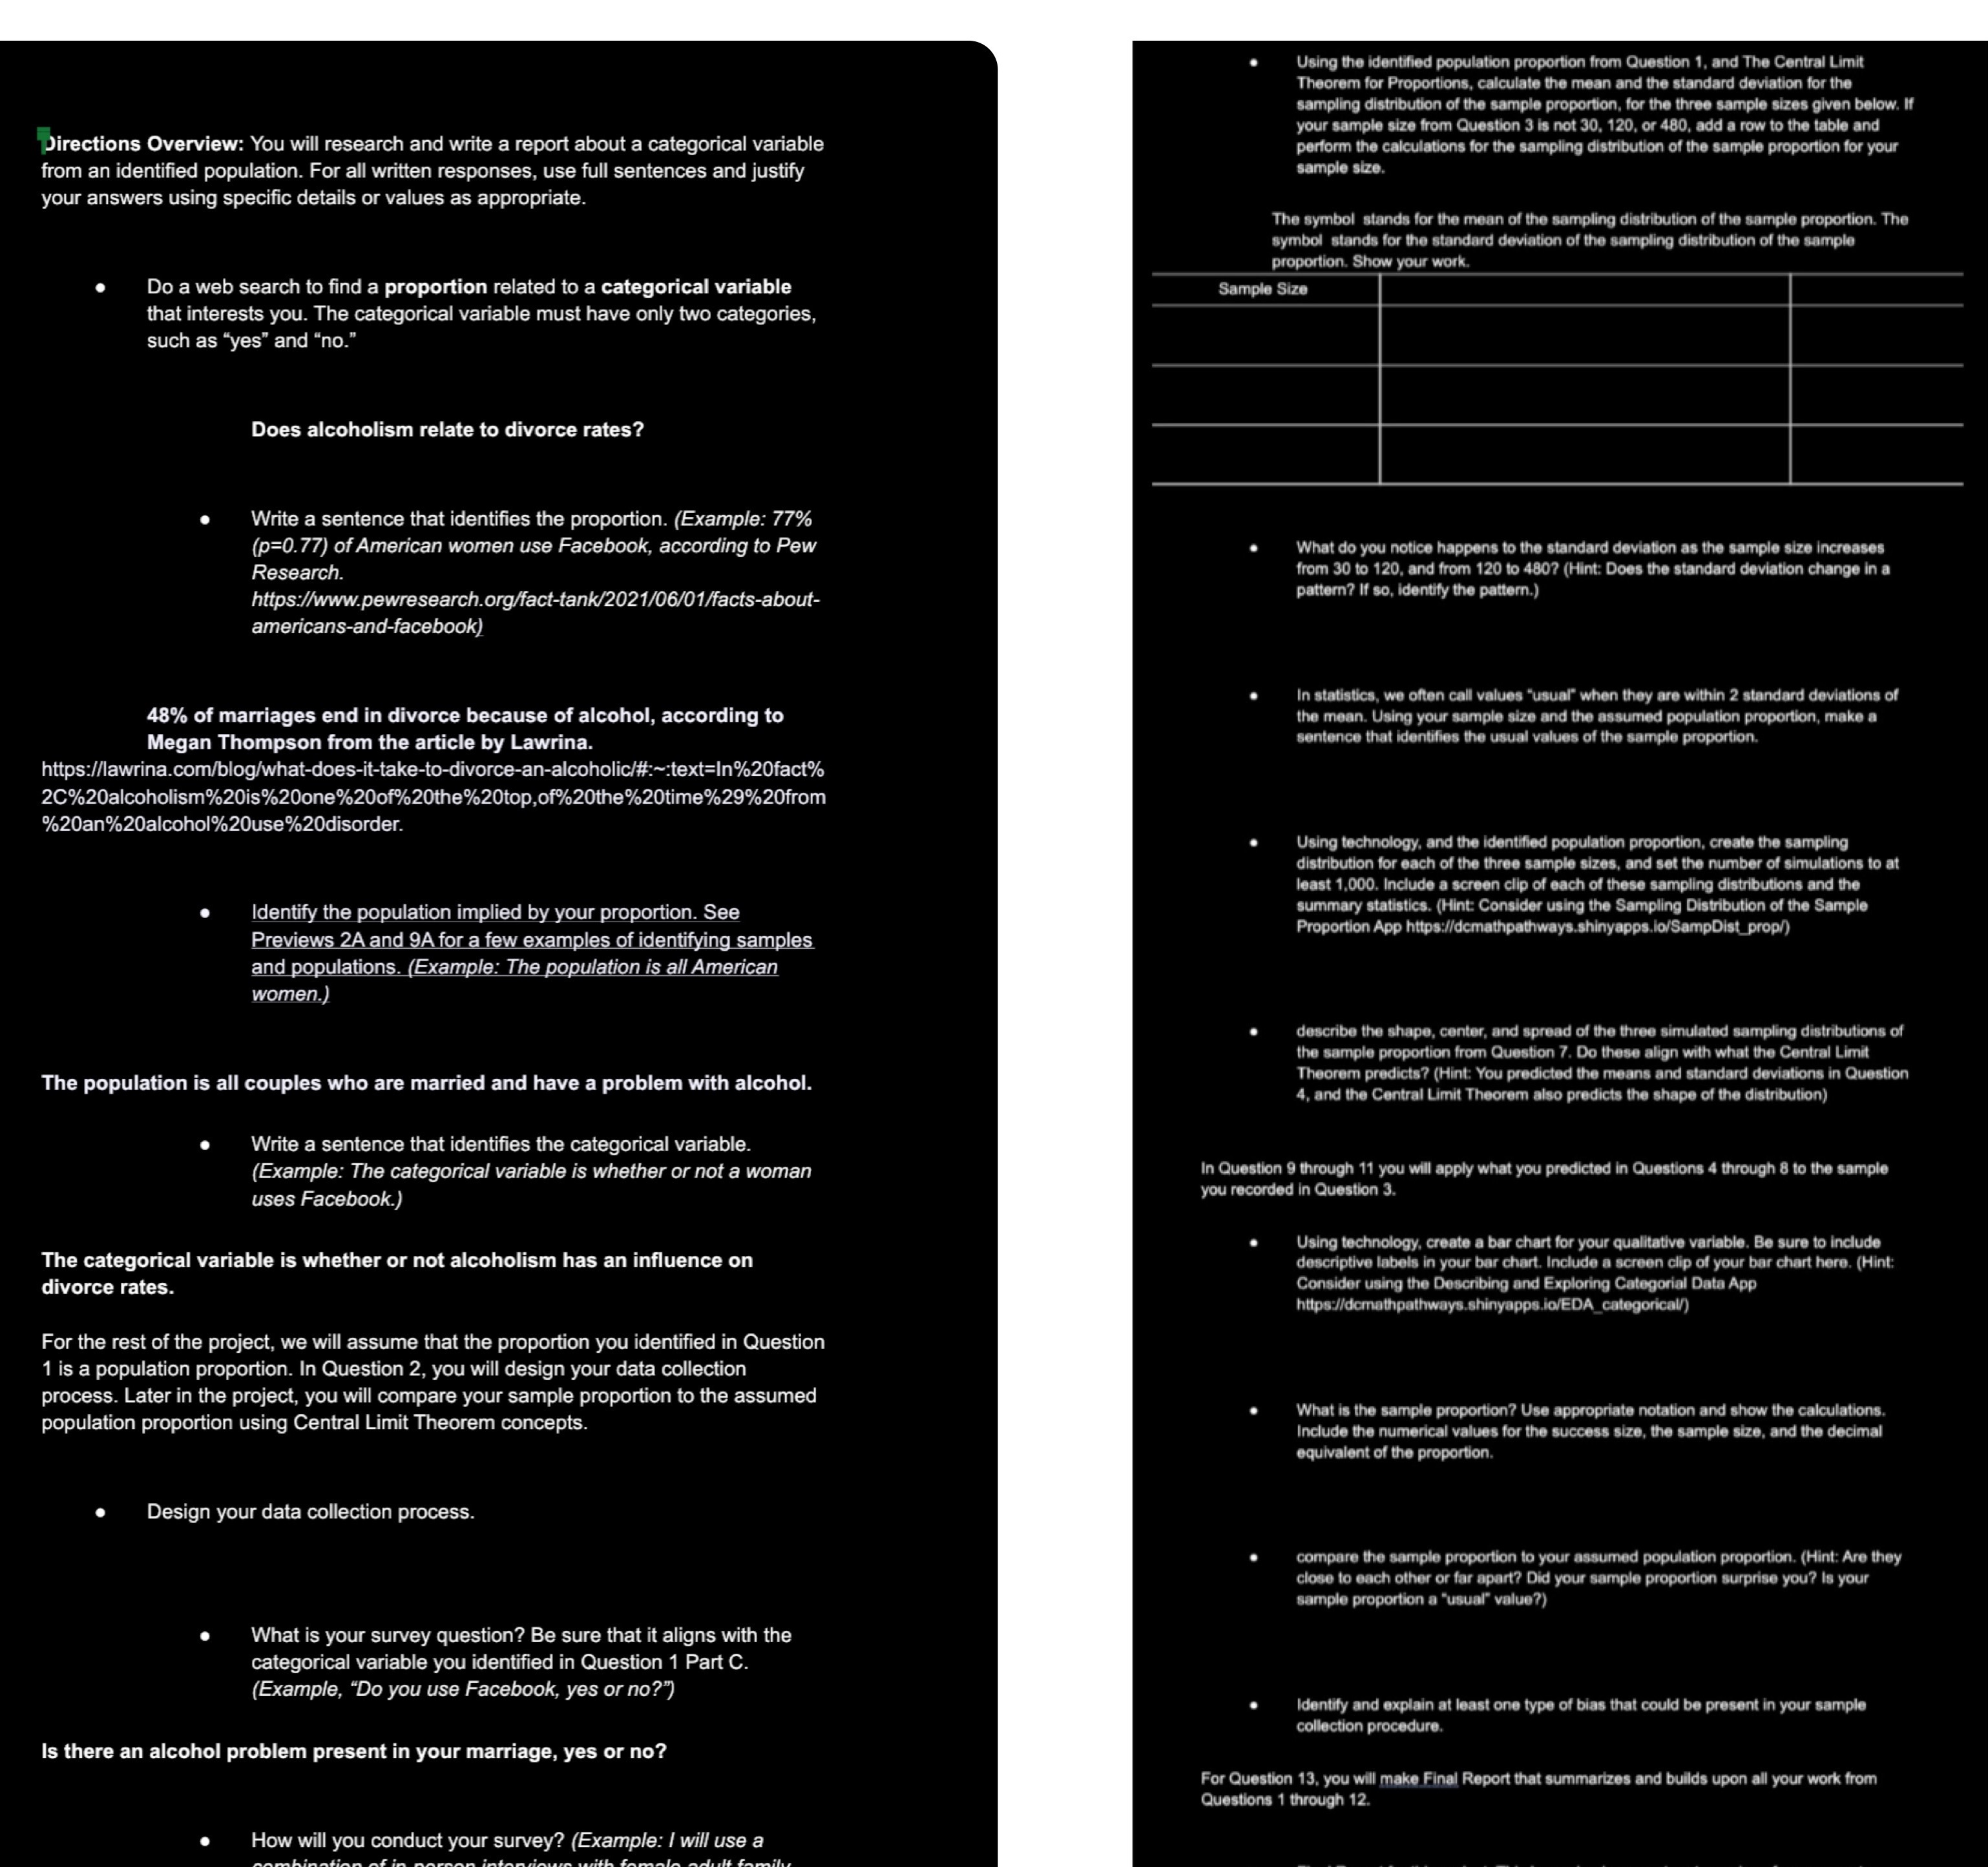
The left side is background information that I came up with and the right side is the questions I need help with. Thank you in advance.
Using the identified population proportion from Question 1, and The Central Limit Theorem for Proportions, sampling distribution of the samp your sample size from Question 3 is not 30, 120, or 480, add a row to the table and Directions Overview: You will research and write a report about a categorical variable perform the calculations for the sampling distribution of the sample proportion for your rom an identified population. For all written responses, use full sentences and justify sample size. your answers using specific details or values as appropriate. The symbol stands for the mean of the sampling distribution of the sample proportion. The symbol stands for the standard deviation of the sampling distribution of the sample proportion. Show your work. Do a web search to find a proportion related to a categorical variable Sample Size that interests you. The categorical variable must have only two categories, such as "yes" and "no." Does alcoholism relate to divorce rates? Write a sentence that identifies the proportion. (Example: 77% (p=0.77) of American women use Facebook, according to Pew What do you notice happens to the standard deviation as the sample size increases Research. 120, and from 120 to 480? (Hint: Does the standard deviation change in a https://www.pewresearch.org/fact-tank/2021/06/01/facts-about- pattern? If so, identify the pattern.) americans-and-facebook) In statistics, we often call values "usual" when they are within 2 standard deviations of 48% of marriages end in divorce because of alcohol, according to the mean. Using your sample size and the assumed population proportion, make a Megan Thompson from the article by Lawrina. sentence that identifies the usual values of the sample proportion. https://lawrina.com/blog/what-does-it-take-to-divorce-an-alcoholic/#:~:text=In%20fact% 20%20alcoholism%20is%20one%20of%20the%20top,of%20the%20time%29%20from %20an%20alcohol%20use%20disorder. g technology, and the identified population proportion, create distribution for each of the three sample sizes, and set the number of simulations to a least 1,000. Include a screen clip of each of these sampling distributions and the Identify the population implied by your proportion. See ics. (Hint: Consider using the Sampling Distribution of the Sample Previews 2A and 9A for a few examples of identifying samples Proportion App https://dcmathpathways.shinyapps.lo/SampDist_prop/) and populations. (Example: The population is all American women.) describe the shape, center, and spread of the three simulated sampling distributions of the sample proportion from Question 7. Do these align with what the Central Limit The population is all couples who are married and have a problem with alcohol. Theorem predicts? (Hint: You p (Hint: You predicted the means and standard deviations in Question 4, and the Central Limit Theorem also predicts the shape of the distribution) Write a sentence that identifies the categorical variable. Example: The categorical variable is whether or not a woman In Question 9 through 11 you will apply what you predicted in Questions 4 through 8 to the sample uses Facebook.) you recorded in Question 3. Using technology, create a bar chart for your qualitative variable. Be sure to include The categorical variable is whether or not alcoholism has an influence on descriptive labels in your bar chart. Include a screen clip of your bar chart here. (Hint: divorce rates. Consider using the Describing and Exploring Categorial Data App https://domathpathways.shinyapps.io/EDA_categorical/) For the rest of the project, we will assume that the proportion you identified in Question 1 is a population proportion. In Question 2, you will design your data collection process. Later in the project, you will compare your sample proportion to the assumed What is the sample proportion? Use appropriate notation and show the calculations. population proportion using Central Limit Theorem concepts. Include the numerical values for the success size, the sample size, and the decimal equivalent of the proportion. Design your data collection process. compare the sample proportion to your assumed population proportion. (Hint: Are they close to each other or far apart? Did your sample proportion surprise you? is your sample proportion a "usual" value?) What is your survey question? Be sure that it aligns with the categorical variable you identified in Question 1 Part C. (Example, "Do you use Facebook, yes or no?") Identify and explain at least one type of bias that could be present in your sample collection procedure. Is there an alcohol problem present in your marriage, yes or no? For Question 13, you will make Final Report that s Questions 1 through 12. How will you conduct your survey? (Example: I will use a


