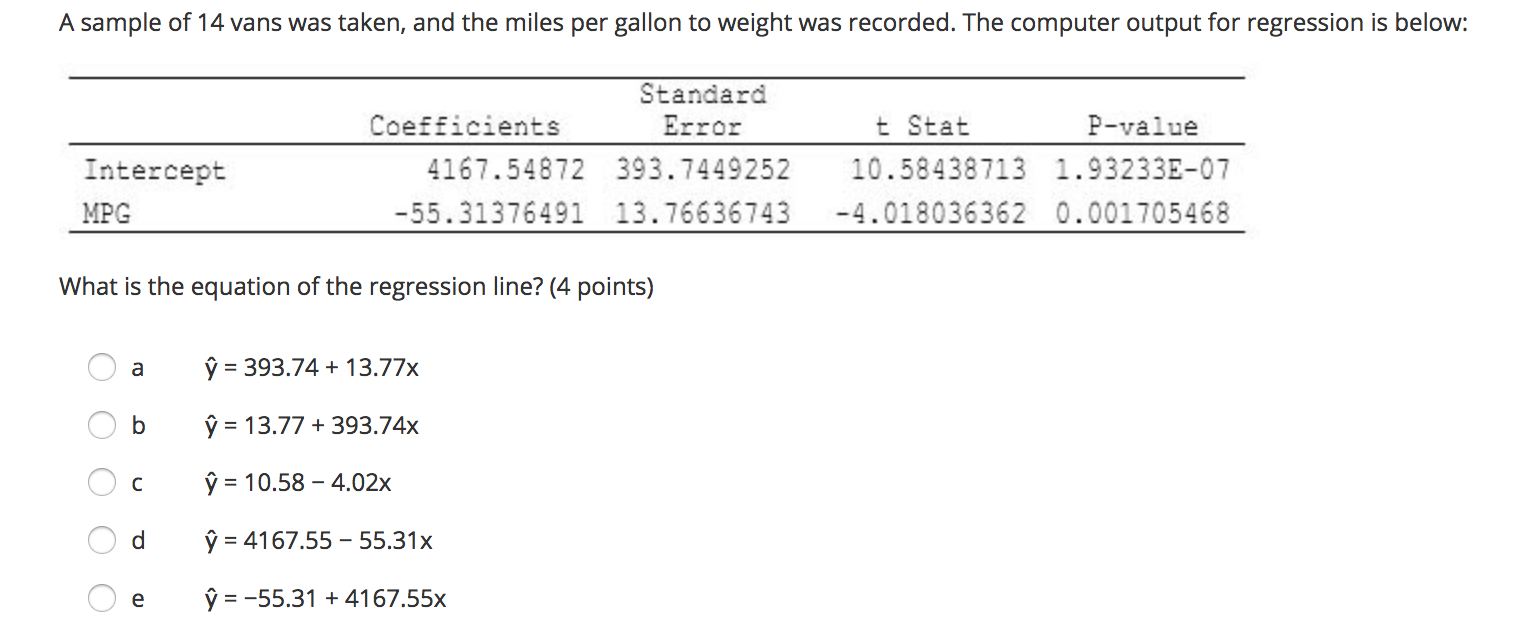
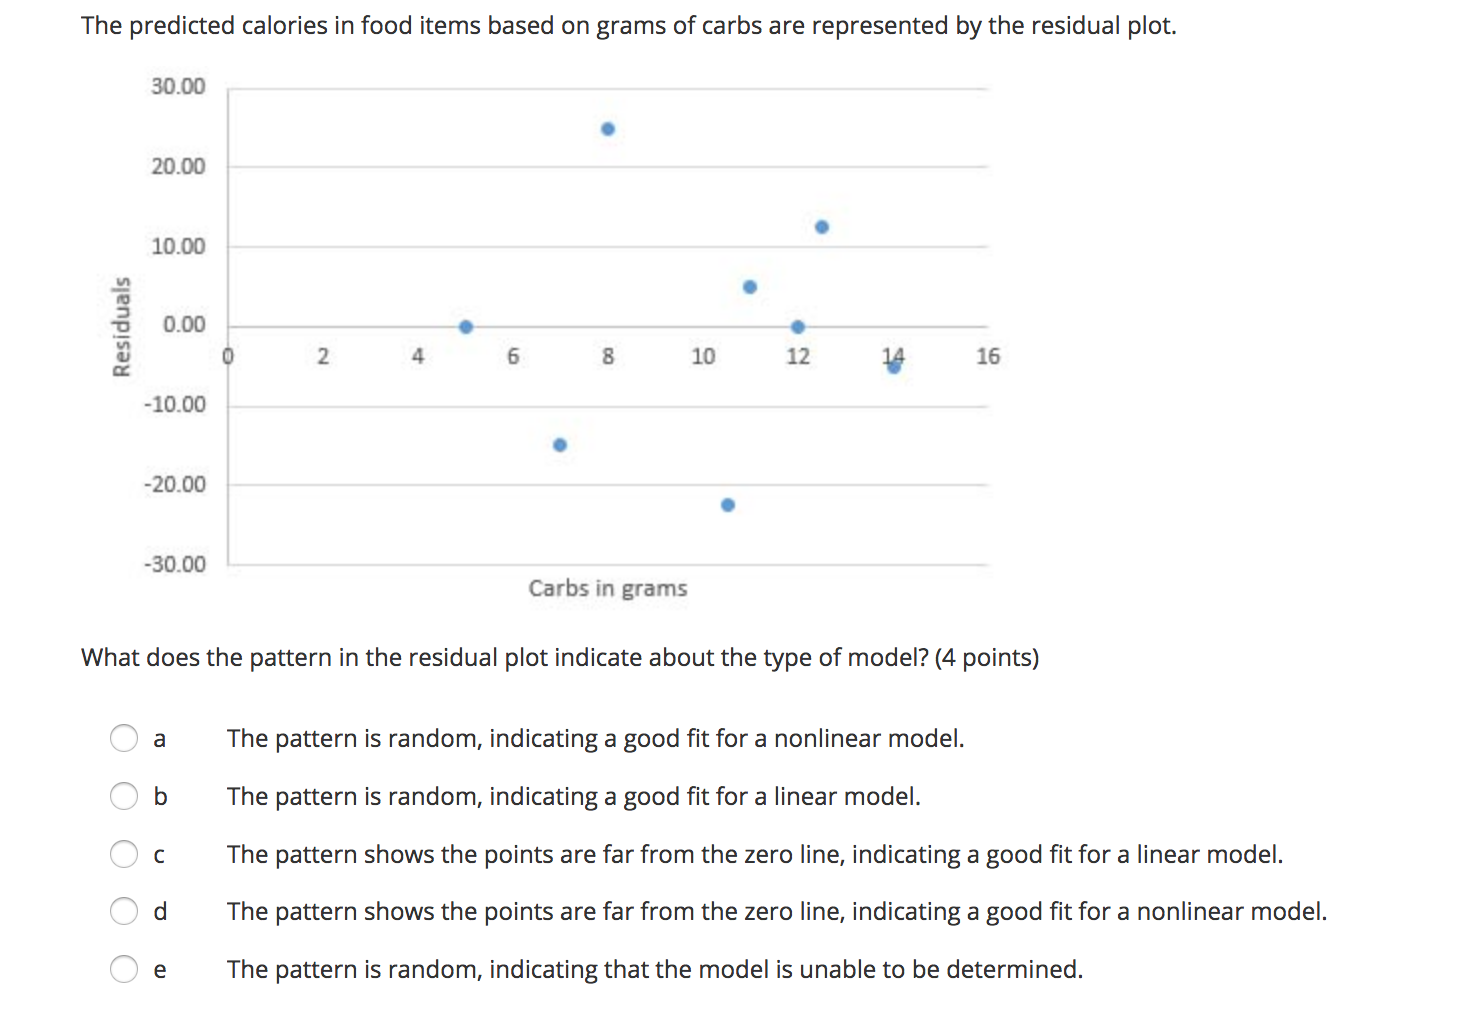
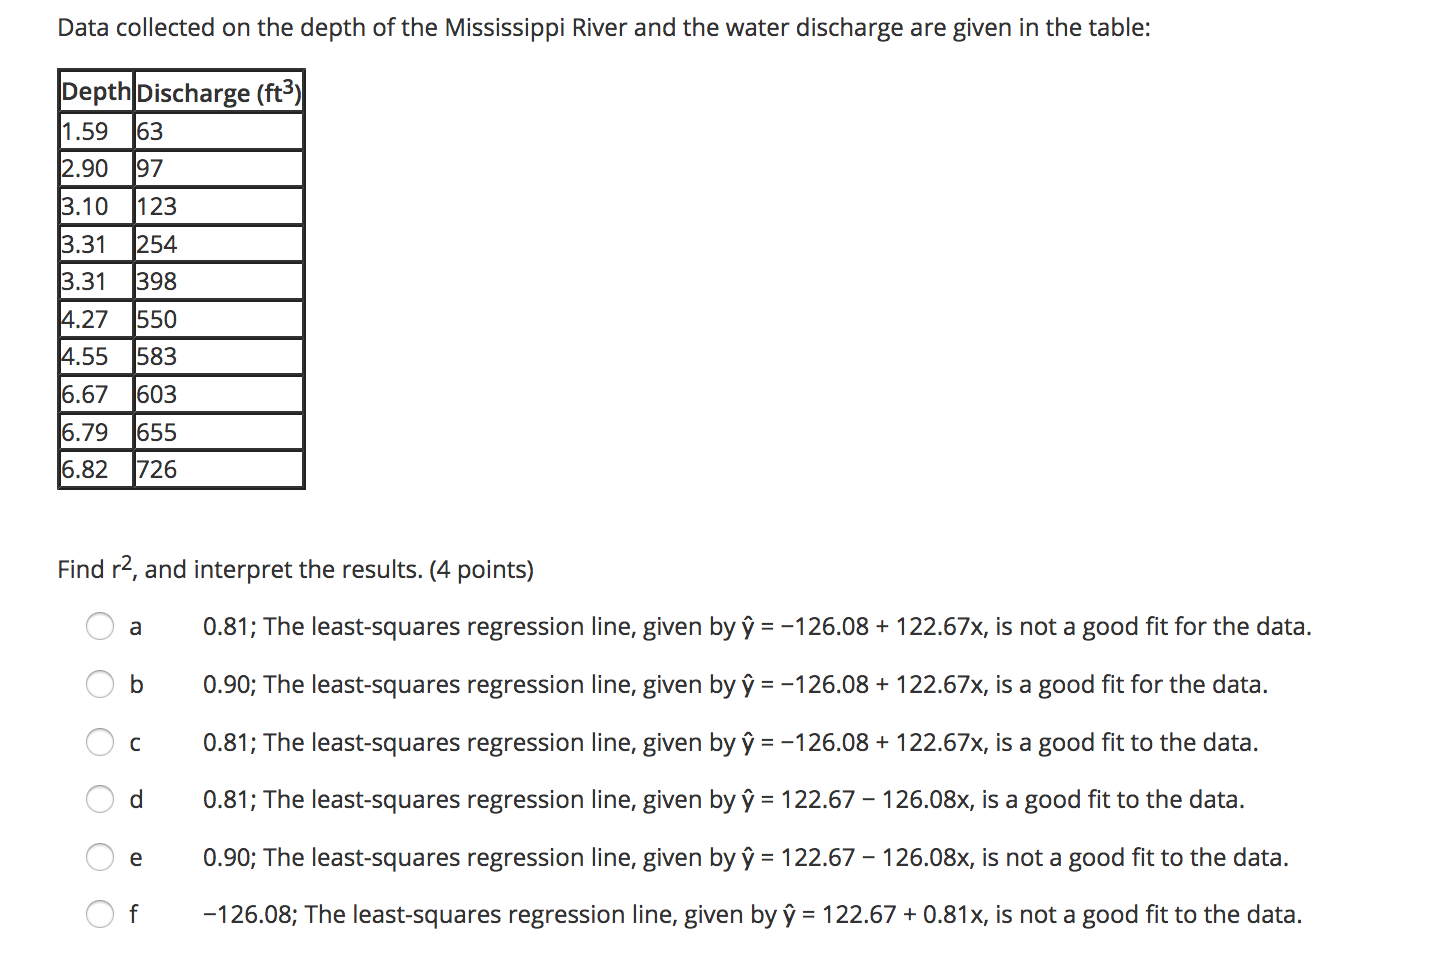
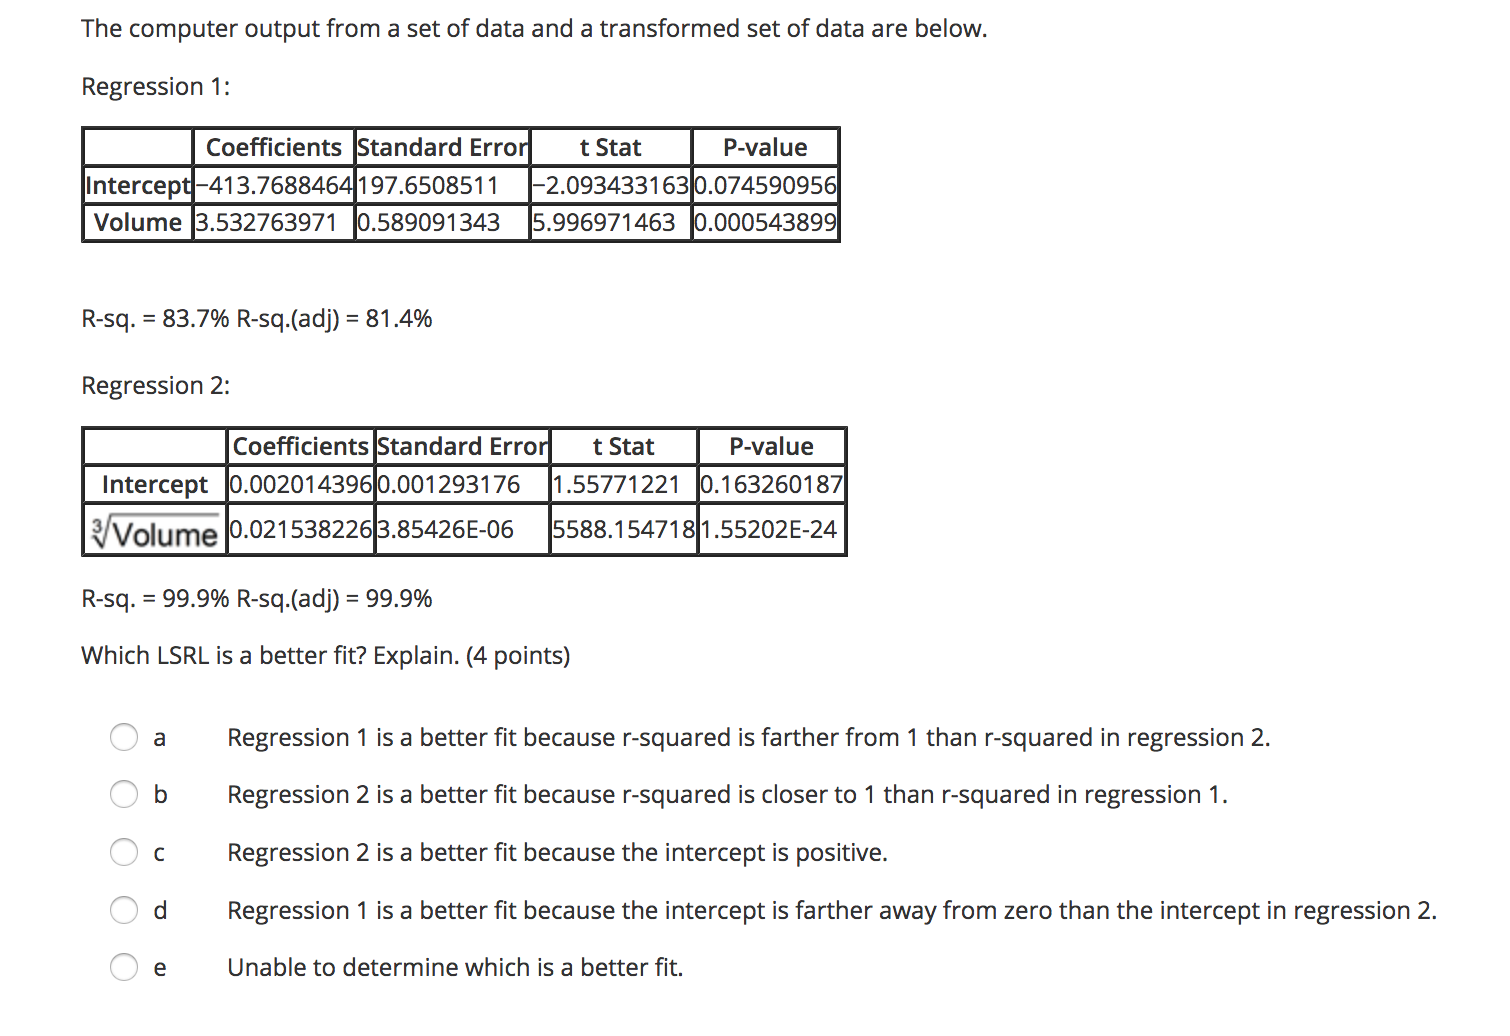
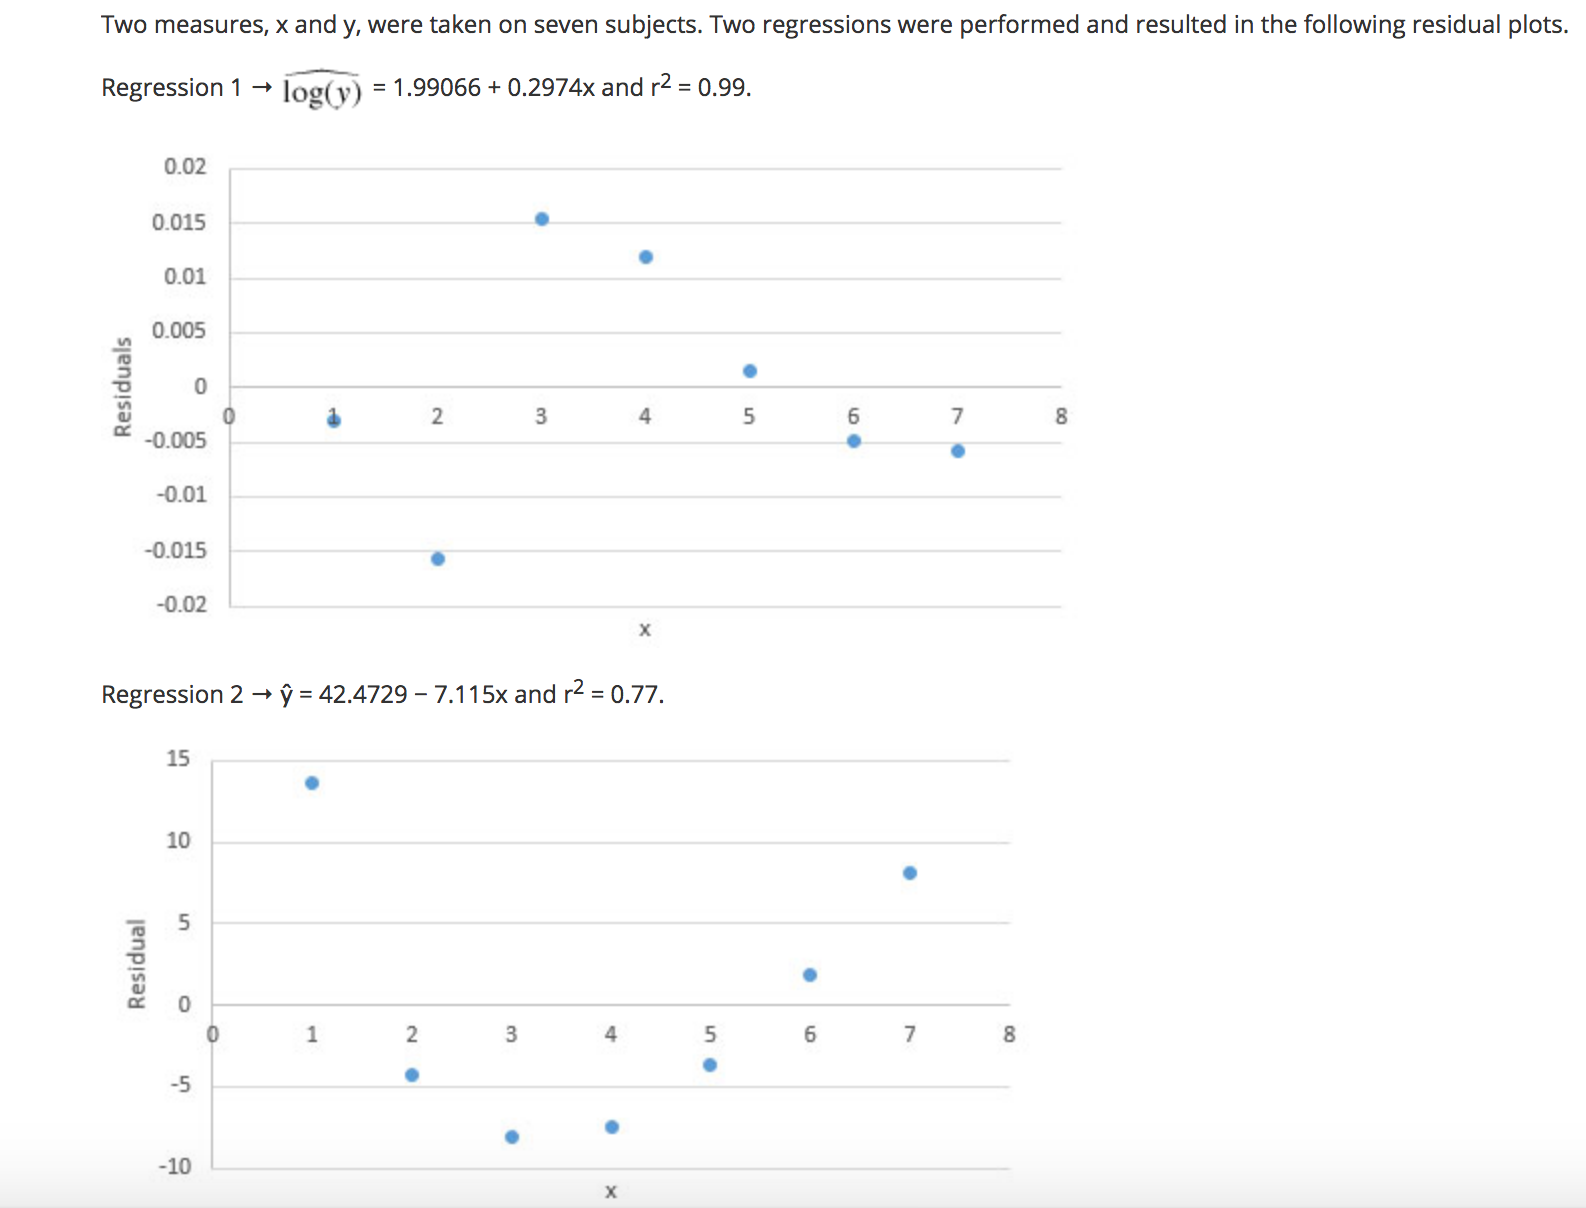
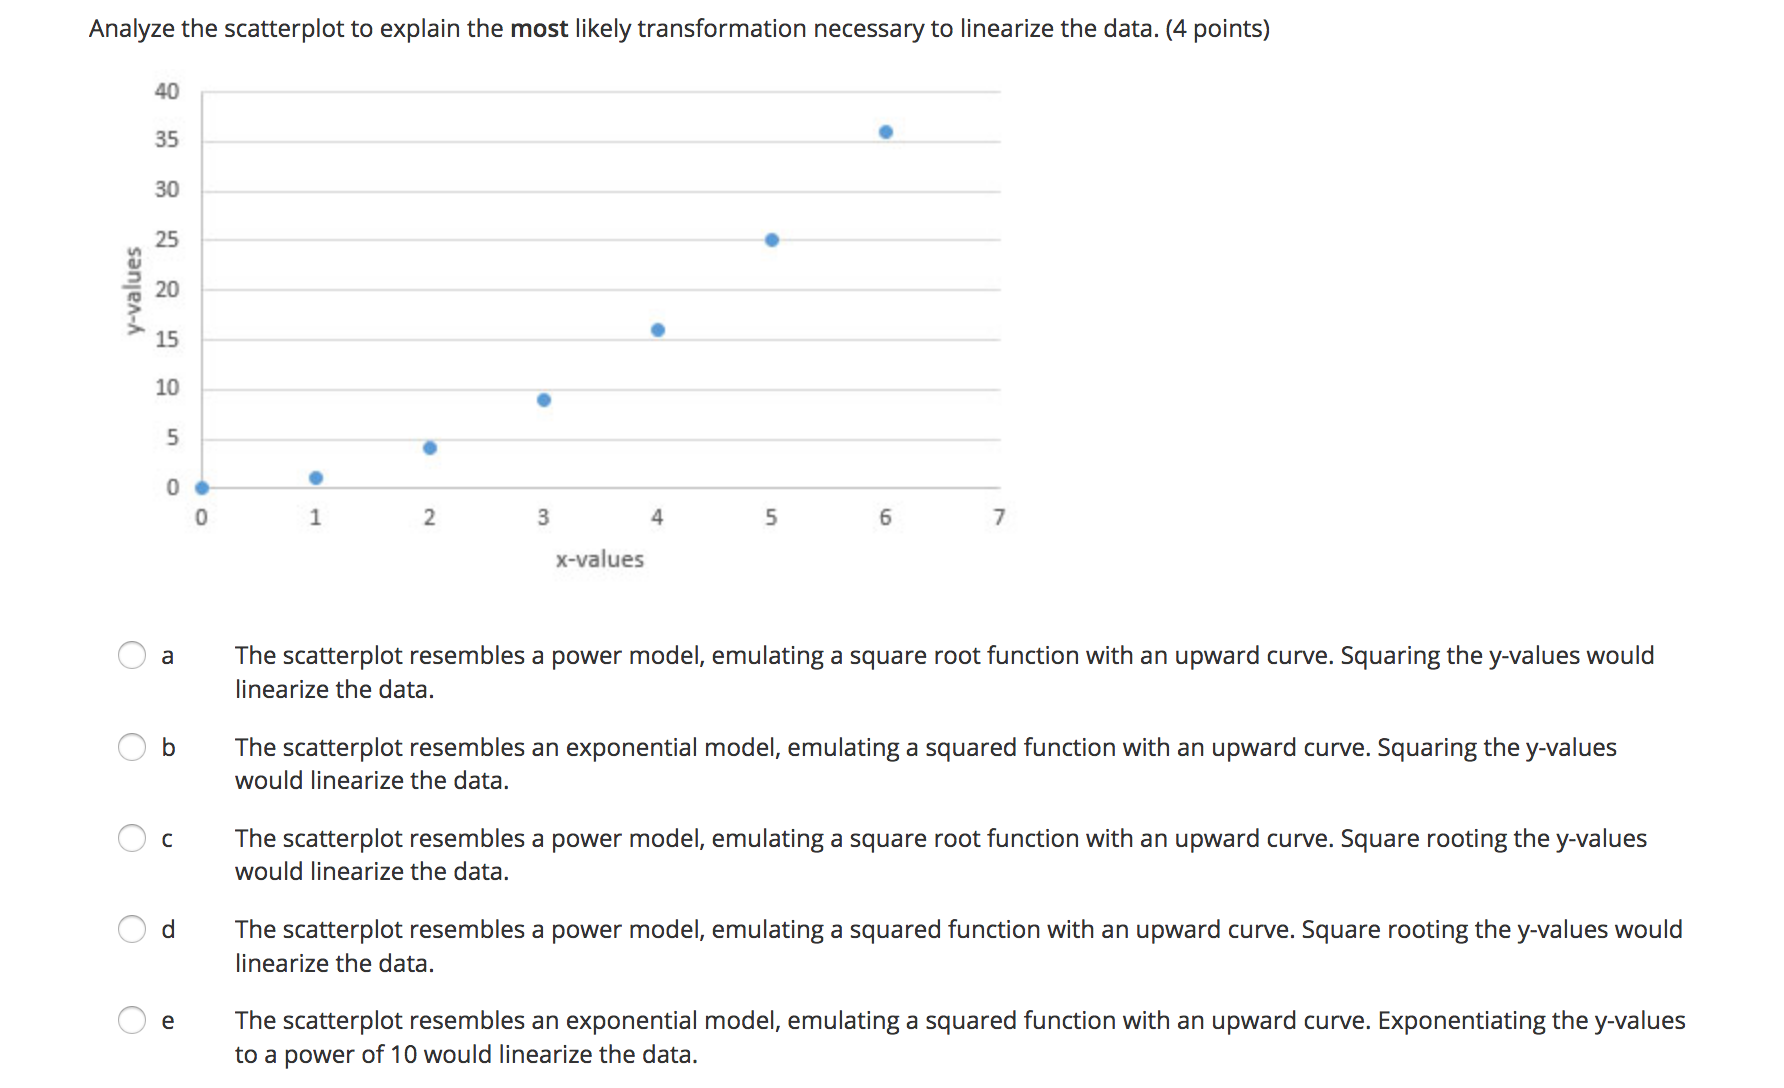
The level of college education and wages earned are known to have a strong positive association. Karen concluded that a college education causes higher earnings. Is Karen's conclusion valid? Explain. (4 points) Oa Karen's conclusion is not valid because association does not imply causation. Ob Karen's conclusion is valid because association does imply causation. O c Karen's conclusion is not valid because causation does not imply association. Od Karen's conclusion is valid because causation does imply association.A sample of 14 vans was ta ken, and the miles per gallon to weight was recorded. The computer output for regression is below: Standard Coefficients Error t Stat P-value Intercept 416154872 393.7449252 10.58438713 1.932332-07 MPG -55.31376491 13.76636743 -4.018036362 0.001705468 What is the equation of the regression line? (4 points) \\_/ a 9 = 393.74 + 13.77x \\ / b 9 = 13.77 + 393.74x \\J C V = 10.58 - 4.02X \\ / d V = 4167.55 - 55.31x \\_/ e V = -55.31 + 4167.55X The mean and standard deviation for the number of burglary crimes in the U.S. from 1995 to 2010 are it = 458,329 and 5X = 29,437. The mean and standard deviation for number of theft crimes in the U.S. for the same time period are it = 738,294 and sy = 45,377. The correlation coefcient is r = 0.89. Find the equation for the least-squares regression line for number of theft crimes compared with number of burglary crimes. (4 points) C a v = 473,672.51 + 0.57x C b v = 0.57 + 473,672.51x C c 9 =1.37 + 110,383.27x A d V =110,383.27 + 1.37x e Unable to determine the equation The predicted calories in food items based on grams of carbs are represented by the residual plot. 30.\") 2011) 101]] Residuals D 8 O O -10.00 - -20.00 - -30.00 Carbs in grams What does the pattern in the residual plot indicate about the type of model? (4 points) A a The pattern is random, indicating a good fit for a nonlinear model. A b The pattern is random, indicating a good fit for a linear model. A c The pattern shows the points are far from the zero line, indicating a good t for a linear model. A The pattern shows the points are far from the zero line, indicating a good t for a nonlinear model. A x ,1 e The pattern is random, indicating that the model is unable to be determined. Data collected on the depth of the Mississippi River and the water discharge are given in the table: @ m_ -_ Find r2, and interpret the results. (4 points) /"\\ 1118 b C d 0.81; The least-squares regression line, given by 9 = 126.08 + 122.67x, is not a good t for the data. 0.90; The least-squares regression line, given by 9 = 126.08 + 122.67x, is a good t for the data. 0.81: The least-squares regression line, given by 9 = 126.08 + 122.67x, is a good t to the data. 0.81: The least-squares regression line, given by 9 = 122.67 126.08x, is a good fit to the data. 0.90; The least-squares regression line, given by 9 = 122.67 126.08x, is not a good fit to the data. 126.08; The least-squares regression line, given by? = 122.67 + 0.81 x, is not a good t to the data. What variables can be transformed to achieve linearity? (4 points) O a Independent variable only Ob Dependent variable only O c r-squared Od Both independent and dependent variables O e Independent variable only, dependent variable only, or both variablesThe computer output from a set of data and a transformed set of data are below. Regression 1: -_St-'mdaIrd Erro \" Mm 3.768846 197.6508511 2.093433163 .074590956 -3.532763971 0589091343 5996971463 .000543899 Rsq. = 83.7% R-sq.(adj) = 81.4% Regression 2: m M HVdume 0.021538226 3.85426E-06 5588.1547181.55202E-24 R-sq. = 99.9% R-sq.(adj) = 99.9% Which LSRL is a better t? Explain. (4 points) IA a Regression 1 is a better fit because rsquared is farther from 1 than rsquared in regression 2. A b Regression 2 is a better fit because rsquared is closer to 1 than r-squared in regression 1. A c Regression 2 is a better fit because the intercept is positive. A d Regression 1 is a better fit because the intercept is farther away from zero than the intercept in regression 2. e Unable to determine which is a better fit. Two measures, x and y, were taken on seven subjects. Two regressions were performed and resulted in the following residual plots. Regression 1 - log(y) = 1.99066 + 0.2974x and r2 = 0.99. 0.02 0.015 0.01 Residuals 0.005 0 2 3 4 5 -0.005 -0.01 -0.015 -0.02 X Regression 2 - y = 42.4729 - 7.115x and r2 = 0.77. 15 10 Residual 5 0 1 3 -5 . N 4 . UI 6 7 -10 XWhich of the following conclusions is best supported by the evidence above? (4 points) a Regression 1 is a better fit because there appears to be a nonlinear relationship between x and y. Ob Regression 2 is a better fit because there appears to be a nonlinear relationship between x and y. O c Regression 1 is a better fit because there appears to be a linear relationship between x and y. O d Regression 2 is a better fit because there appears to be a linear relationship between x and y. O e There is a negative correlation between x and y.The LSRL after an exponential transformation is log \\7 = 0.4785 + 1.468x. What is the exponential form of the regression? (4 points) C a 9 = 29.3765 - 3.00954x C b 9 = 0.4785 - 3.00954X C' c 9 = 0.4785 - 1.468)( C d 9 = 1.468 - 0.4785)( b .. .1 e y = 3.00954 - 29.3765x Analyze the scatterplot to explain the most likely transformation necessary to linearize the data. (4 points) 40 35 30 y-values 25 20 15 10 5 0 . 0 2 3 4 5 6 x-values O a The scatterplot resembles a power model, emulating a square root function with an upward curve. Squaring the y-values would linearize the data. Ob The scatterplot resembles an exponential model, emulating a squared function with an upward curve. Squaring the y-values would linearize the data. O c The scatterplot resembles a power model, emulating a square root function with an upward curve. Square rooting the y-values would linearize the data. Od The scatterplot resembles a power model, emulating a squared function with an upward curve. Square rooting the y-values would linearize the data. O e The scatterplot resembles an exponential model, emulating a squared function with an upward curve. Exponentialing the y-values to a power of 10 would linearize the data

