Answered step by step
Verified Expert Solution
Link Copied!

Question

1 Approved Answer

The log-normal distribution is the probability distribution of a random variable whose logarithm follows a normal distribution.Unfortunately, we are witnessing a practical application of it

The log-normal distribution is the probability distribution of a random variable whose logarithm follows a normal distribution.Unfortunately, we are witnessing a practical application of it in the log-normal distribution of new cases of COVID-19 per day. From the video lectures of this course, we also know that infinance, the log-normal distribution is often used to model the price of a stock and forms the foundation of many asset pricing models. Which of the following is one of the reasons that thelog-normal distribution is used to model stock prices rather than the normal distribution?

A.

The normal distribution has positive skewness.

B.

The normal distribution overestimates the probability of tail risks.

C.

The normal distribution is leptokurtic.

D.

The normal distribution describes multiplicative situations like compounding stock prices.

E.

The normal distribution allows for negative stock prices.
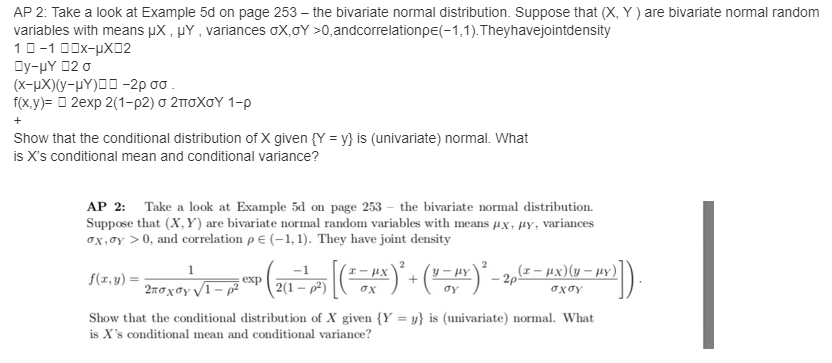
image text in transcribedimage text in transcribedimage text in transcribedimage text in transcribed
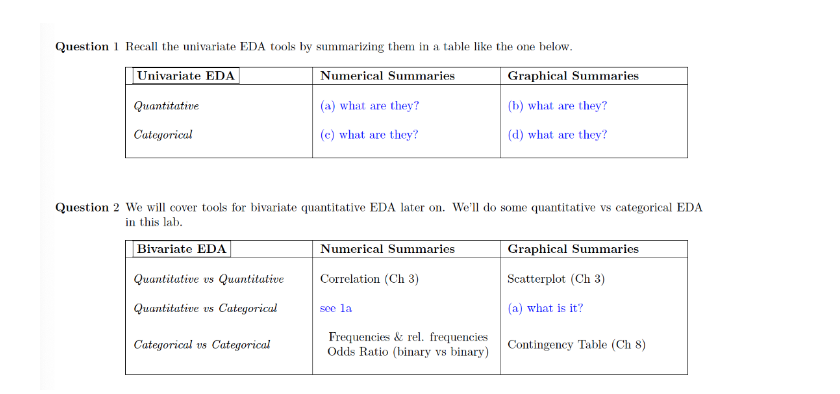
\fQuestion 1 Recall the univariate EDA tools by summarizing them in a table like the one below. Univariate EDA Numerical Summaries Graphical Summaries Quantitative (a) what are they? (b) what are they? Categorical (c) what are they? (d) what are they? Question 2 We will cover tools for bivariate quantitative EDA later on. We'll do some quantitative vs categorical EDA in this lab. Bivariate EDA Numerical Summaries Graphical Summaries Quantitative us Quantitative Correlation (Ch 3) Scatterplot (Ch 3) Quantitative us Categorical soe la (a) what is it? Categorical us Categorical Frequencies & rel. frequencies Odds Ratio (binary vs binary) Contingency Table (Ch 8)1. Suppose (X, Y, Z) follow the multivariate normal distribution: 1 0.4 0.2 ( X , Y, Z ) ~ N 3 0.4 1 0.3 (2) 0.2 0.3 1 (a) Find the distribution of X + Y + Z; (b) Find Cov(2X - 3Y + Z, X + Y - Z). Hint for 1.: A linear transform of a univariate/multivariate normal r.v. is a univariate/multivariate normal random variable. A univariate/multivariate normal random variable is entirely characterized by its mean and its variance / covariance matrix.Question 25 Simple Regression analysis and Mumvariate Regression Analysis me raised to each other in ihn following way; @) Both techniques use a goodness of fit musmire, but the goodness of fit meamie in Muhivanale Regression adjusts Nu the fact that an coun miinhis aduspammin Ingphompants Simple Regression is simpler than Multivariate Regression because the dependent variable is aways a straight line function of the independent sunable un a graph Multivariate regression always proves causation, but simple regression can never prove causation Both simple and multiple regression face the problem of multicollinearity

Step by Step Solution

There are 3 Steps involved in it

Step: 1

blur-text-image

Get Instant Access to Expert-Tailored Solutions

See step-by-step solutions with expert insights and AI powered tools for academic success

Step: 2

blur-text-image

Step: 3

blur-text-image

Ace Your Homework with AI

Get the answers you need in no time with our AI-driven, step-by-step assistance

Get Started

Recommended Textbook for

Algebra And Trigonometry

Authors: Cynthia Y Young

5th Edition

1119820898, 9781119820895

More Books

Students also viewed these Mathematics questions