Answered step by step
Verified Expert Solution
Link Copied!

Question

1 Approved Answer

The log-normal distribution is the probability distribution of a random variable whose logarithm follows a normal distribution.Unfortunately, we are witnessing a practical application of it

The log-normal distribution is the probability distribution of a random variable whose logarithm follows a normal distribution.Unfortunately, we are witnessing a practical application of it in the log-normal distribution of new cases of COVID-19 per day. From the video lectures of this course, we also know that infinance, the log-normal distribution is often used to model the price of a stock and forms the foundation of many asset pricing models. Which of the following is one of the reasons that thelog-normal distribution is used to model stock prices rather than the normal distribution?

A.

The normal distribution has positive skewness.

B.

The normal distribution overestimates the probability of tail risks.

C.

The normal distribution is leptokurtic.

D.

The normal distribution describes multiplicative situations like compounding stock prices.

E.

The normal distribution allows for negative stock prices.
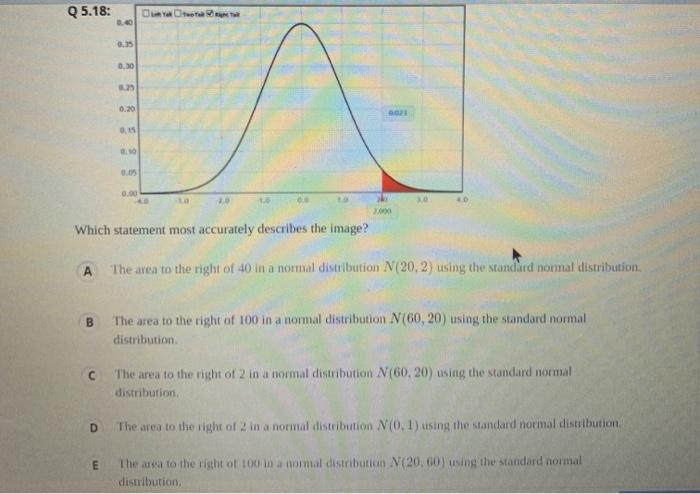
image text in transcribedimage text in transcribedimage text in transcribed
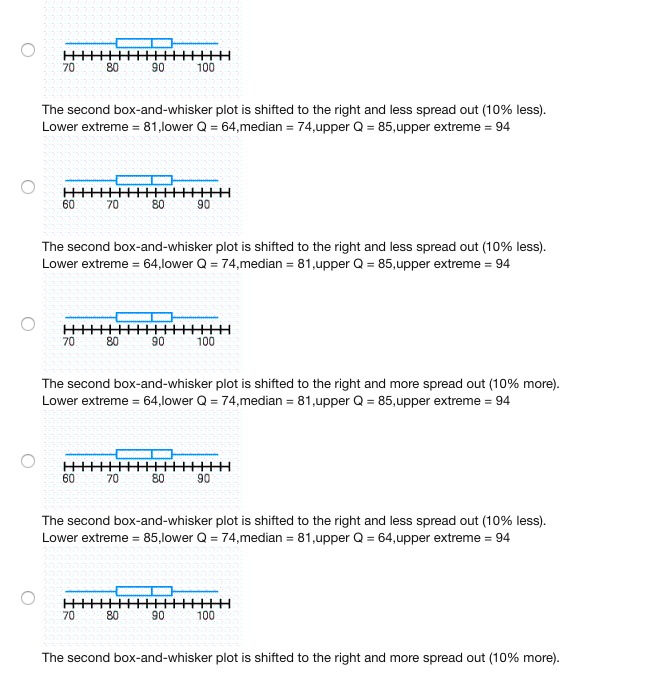
Q 5.18: 0.30 0.90 Which statement most accurately describes the image? A The area to the right of 40 in a normal distribution /V(20. 2) using the standard normal distribution. B The area to the right of 100 in a normal distribution /V(60, 20) using the standard normal distribution C The area to the right of 2 In a normal distribution /(60, 20) using the standard normal distribution. D The area to the right of 2 in a normal distribution V(0; 1) using the standard normal distilbution E The area to the right of 100 in a nomial distribution .V(20. 60 ] using the standard normal distribution,In what simple way are lognormal distributions different from normal distributions? Lognormal distributions are bi-modal and normal distributions are not Lognormal distributions are a subset of the normal distribution Normal distributions are lognormal distributions that have been squared O Lognormal distributions are skewed and normal distributions are notO 70 80 90 100 The second box-and-whisker plot is shifted to the right and less spread out (10% less). Lower extreme = 81,lower Q = 64,median = 74,upper Q = 85,upper extreme = 94 O 60 70 80 90 The second box-and-whisker plot is shifted to the right and less spread out (10% less). Lower extreme = 64,lower Q = 74,median = 81,upper Q = 85, upper extreme = 94 O 80 90 100 The second box-and-whisker plot is shifted to the right and more spread out (10% more). Lower extreme = 64,lower Q = 74,median = 81,upper Q = 85, upper extreme = 94 O 60 70 90 The second box-and-whisker plot is shifted to the right and less spread out (10% less). Lower extreme = 85,lower Q = 74,median = 81,upper Q = 64,upper extreme = 94 O 70 90 100 The second box-and-whisker plot is shifted to the right and more spread out (10% more)

Step by Step Solution

There are 3 Steps involved in it

Step: 1

blur-text-image

Get Instant Access to Expert-Tailored Solutions

See step-by-step solutions with expert insights and AI powered tools for academic success

Step: 2

blur-text-image

Step: 3

blur-text-image

Ace Your Homework with AI

Get the answers you need in no time with our AI-driven, step-by-step assistance

Get Started

Recommended Textbook for

More Books

Students also viewed these Mathematics questions