Answered step by step
Verified Expert Solution
Question
1 Approved Answer
1: Horizontal Analysis Summary financial information for Rosepatch NV is as follows. Plant assets (net) Current assets Total assets December 31, 2020 December 31,
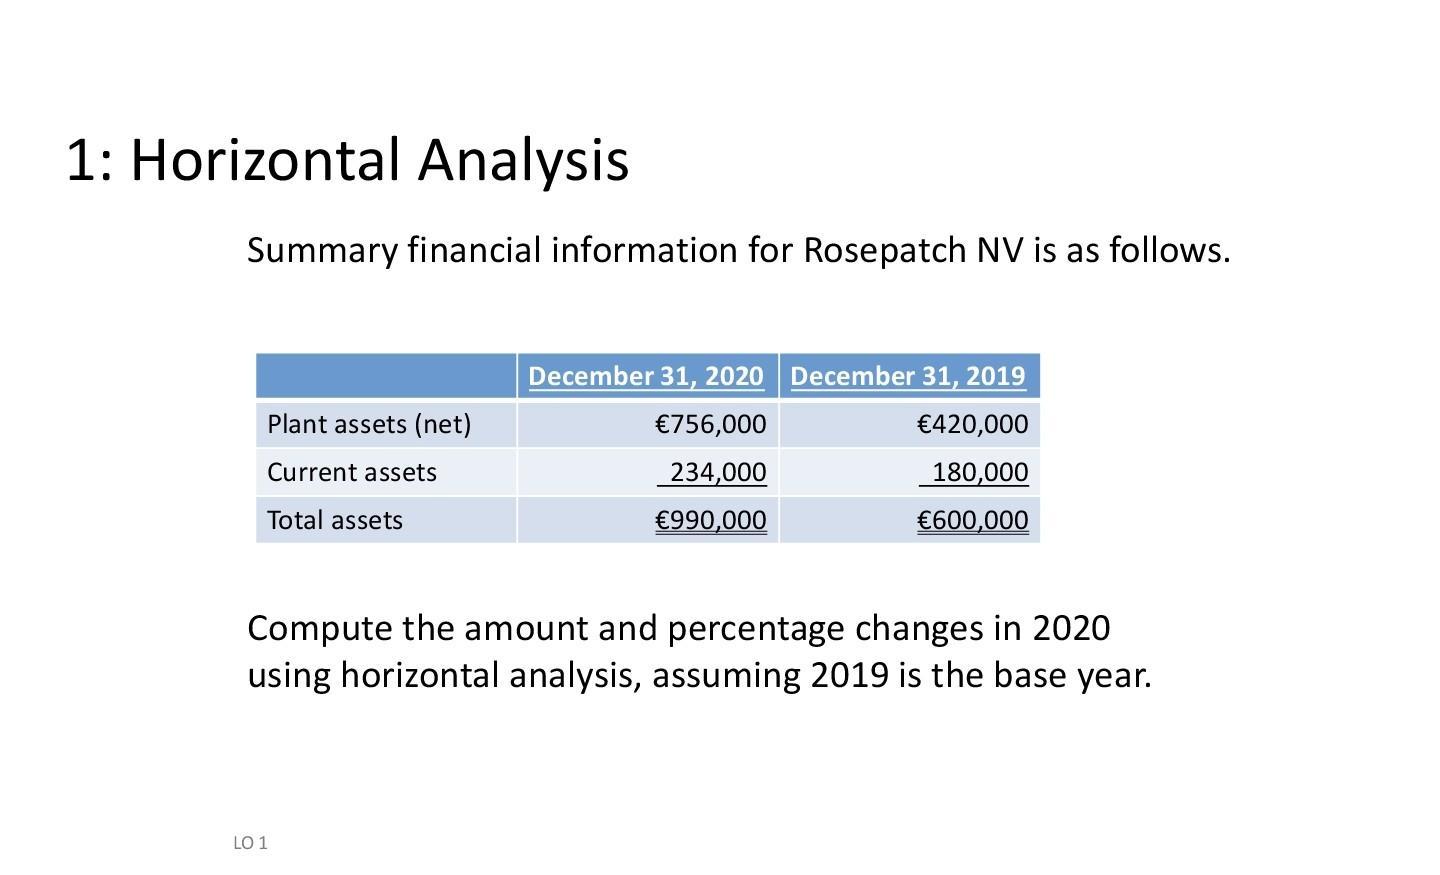
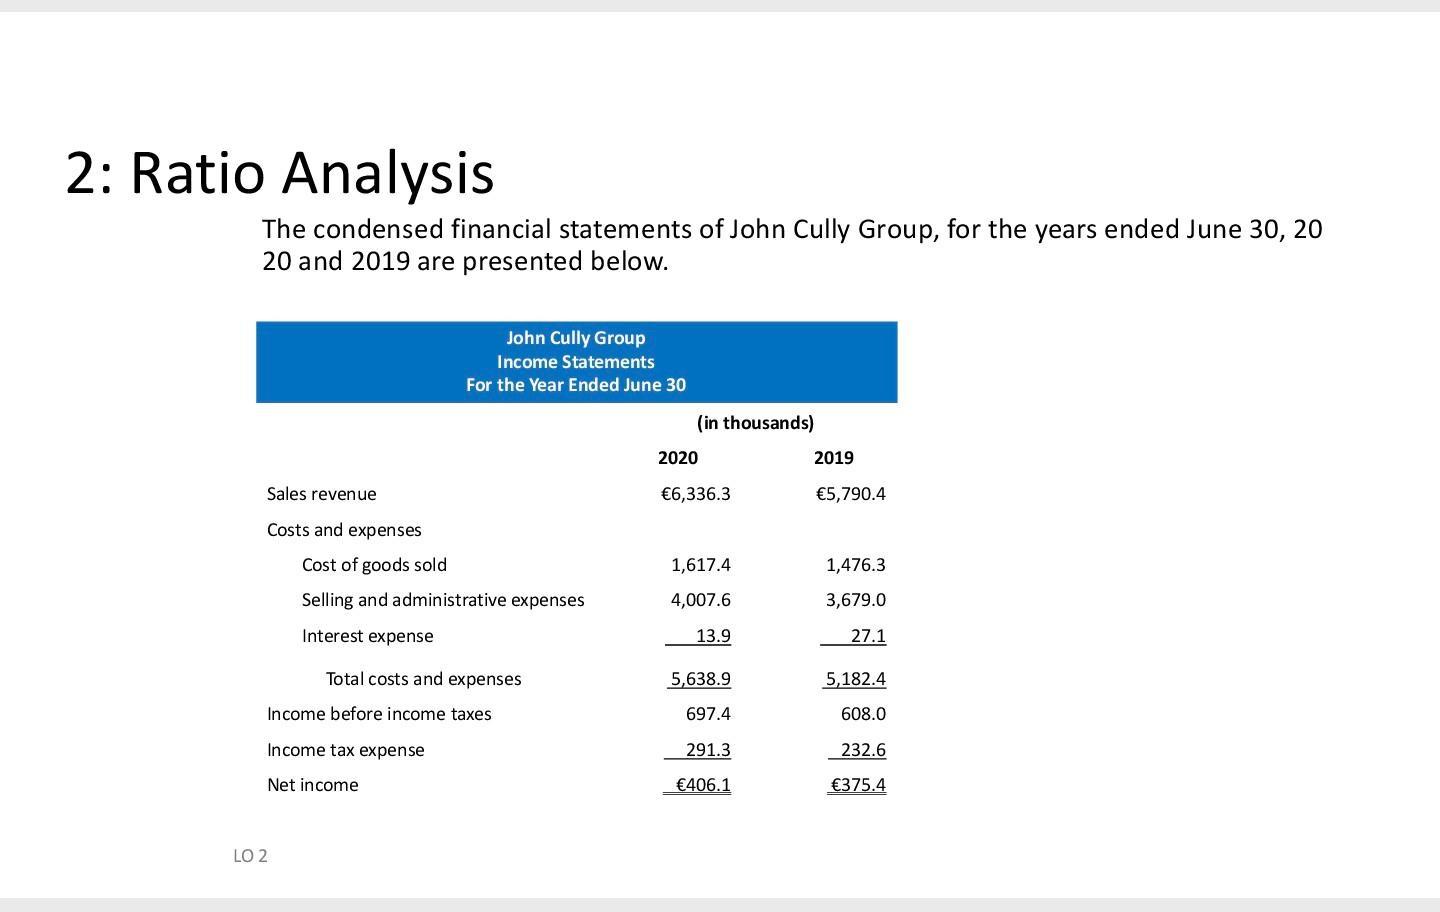
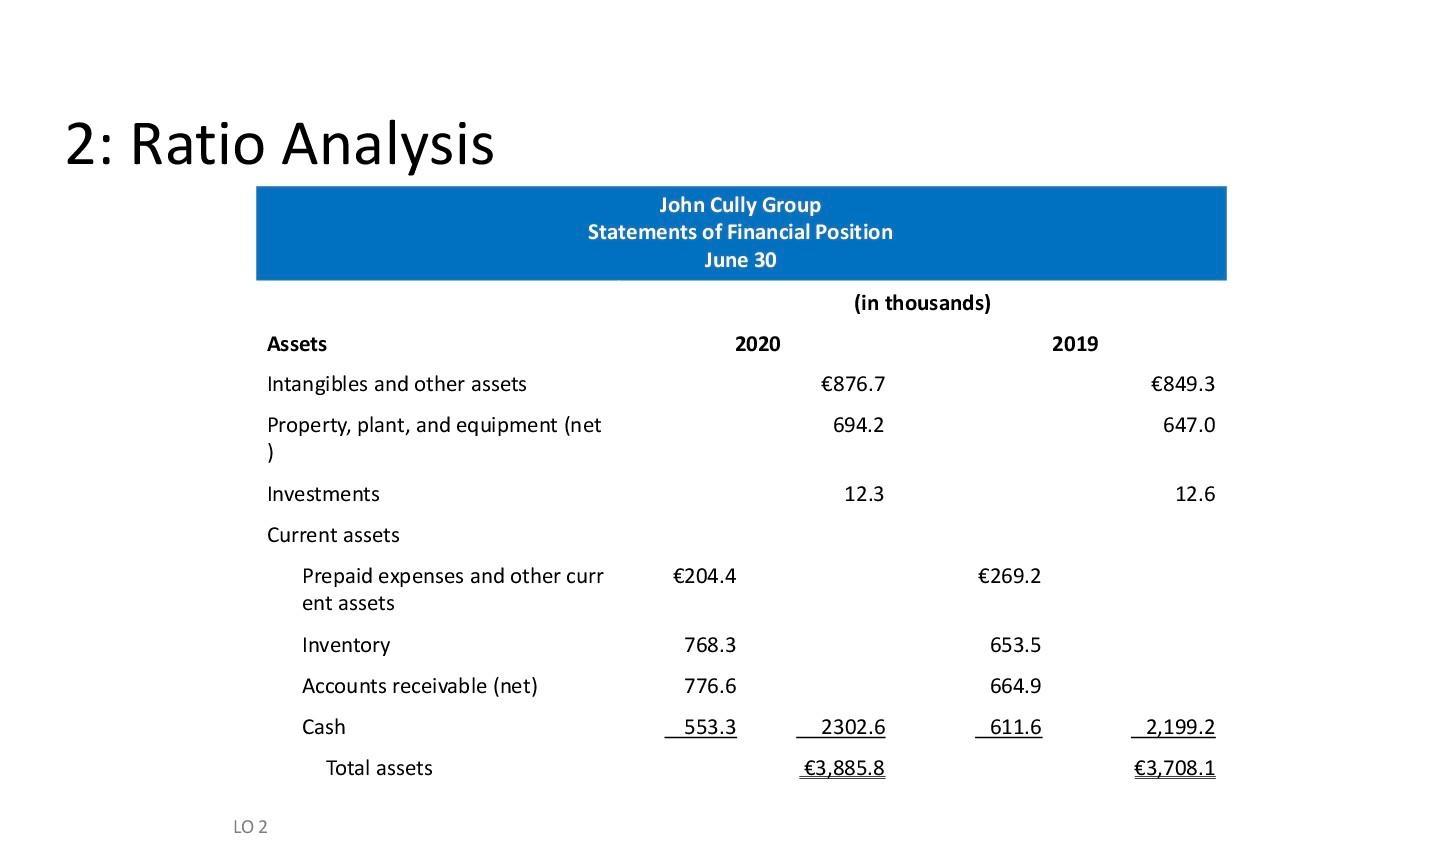
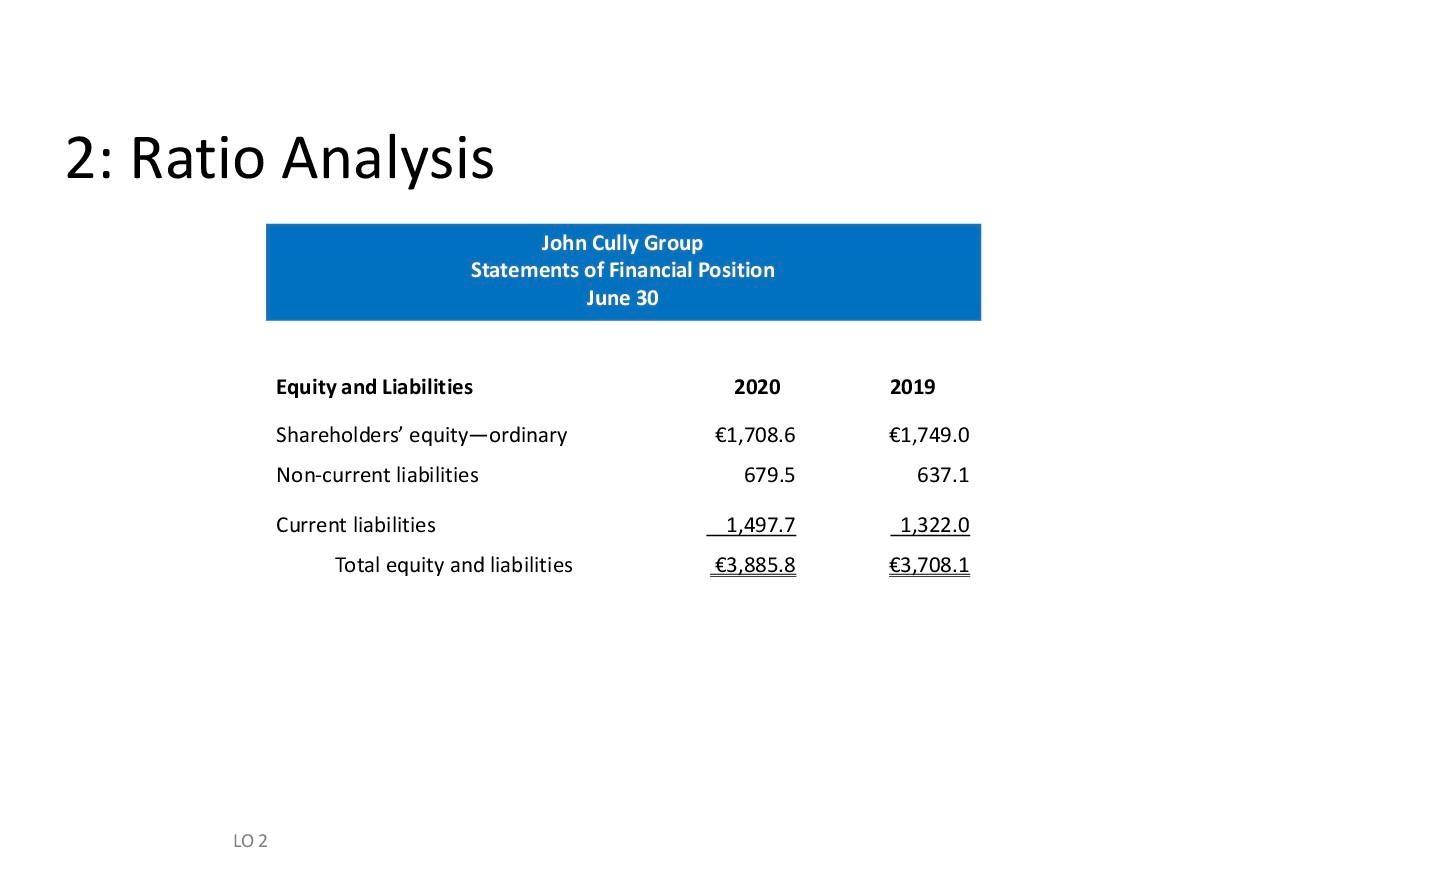
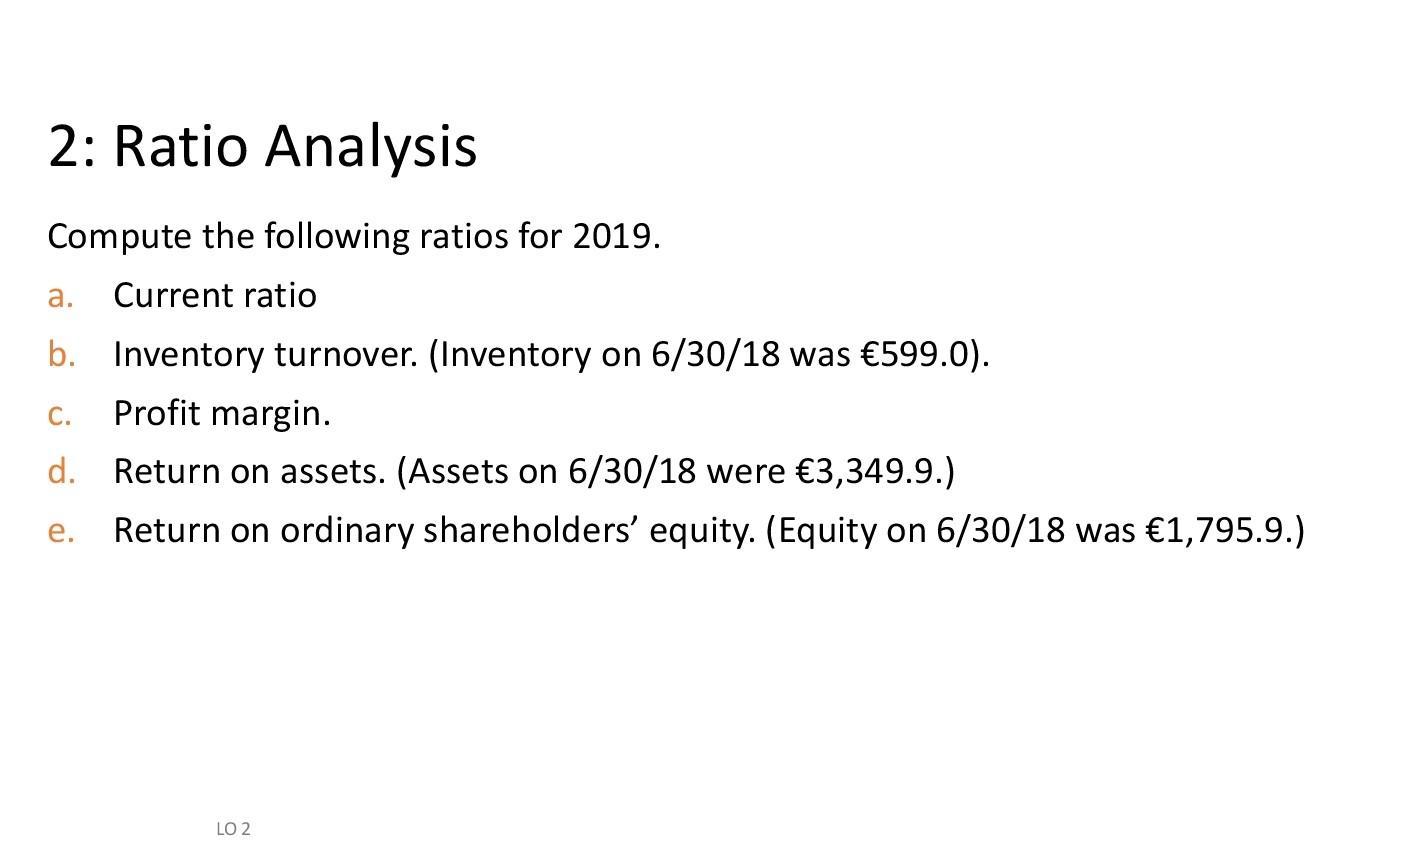
1: Horizontal Analysis Summary financial information for Rosepatch NV is as follows. Plant assets (net) Current assets Total assets December 31, 2020 December 31, 2019 756,000 420,000 234,000 180,000 990,000 600,000 Compute the amount and percentage changes in 2020 using horizontal analysis, assuming 2019 is the base year. LO 1 2: Ratio Analysis The condensed financial statements of John Cully Group, for the years ended June 30, 20 20 and 2019 are presented below. Sales revenue Costs and expenses John Cully Group Income Statements For the Year Ended June 30 LO 2 Cost of goods sold Selling and administrative expenses Interest expense Total costs and expenses Income before income taxes Income tax expense Net income (in thousands) 2020 6,336.3 1,617.4 4,007.6 13.9 5,638.9 697.4 291.3 406.1 2019 5,790.4 1,476.3 3,679.0 27.1 5,182.4 608.0 232.6 375.4 2: Ratio Analysis Assets Intangibles and other assets Property, plant, and equipment (net ) Investments Current assets LO 2 John Cully Group Statements of Financial Position June 30 Prepaid expenses and other curr ent assets Inventory Accounts receivable (net) Cash Total assets 2020 204.4 768.3 776.6 553.3 (in thousands) 876.7 694.2 12.3 2302.6 3,885.8 269.2 653.5 664.9 611.6 2019 849.3 647.0 12.6 2,199.2 3,708.1 2: Ratio Analysis LO 2 John Cully Group Statements of Financial Position June 30 Equity and Liabilities Shareholders' equity-ordinary Non-current liabilities Current liabilities Total equity and liabilities 2020 1,708.6 679.5 1,497.7 3,885.8 2019 1,749.0 637.1 1,322.0 3,708.1 2: Ratio Analysis Compute the following ratios for 2019. a. Current ratio b. Inventory turnover. (Inventory on 6/30/18 was 599.0). C. Profit margin. d. Return on assets. (Assets on 6/30/18 were 3,349.9.) Return on ordinary shareholders' equity. (Equity on 6/30/18 was 1,795.9.) e. LO 2
Step by Step Solution
★★★★★
3.50 Rating (153 Votes )
There are 3 Steps involved in it
Step: 1
Answer SOLUTIONS a b Inventory Turnover d Name of the Ratio e ...
Get Instant Access to Expert-Tailored Solutions
See step-by-step solutions with expert insights and AI powered tools for academic success
Step: 2

Step: 3

Ace Your Homework with AI
Get the answers you need in no time with our AI-driven, step-by-step assistance
Get Started


