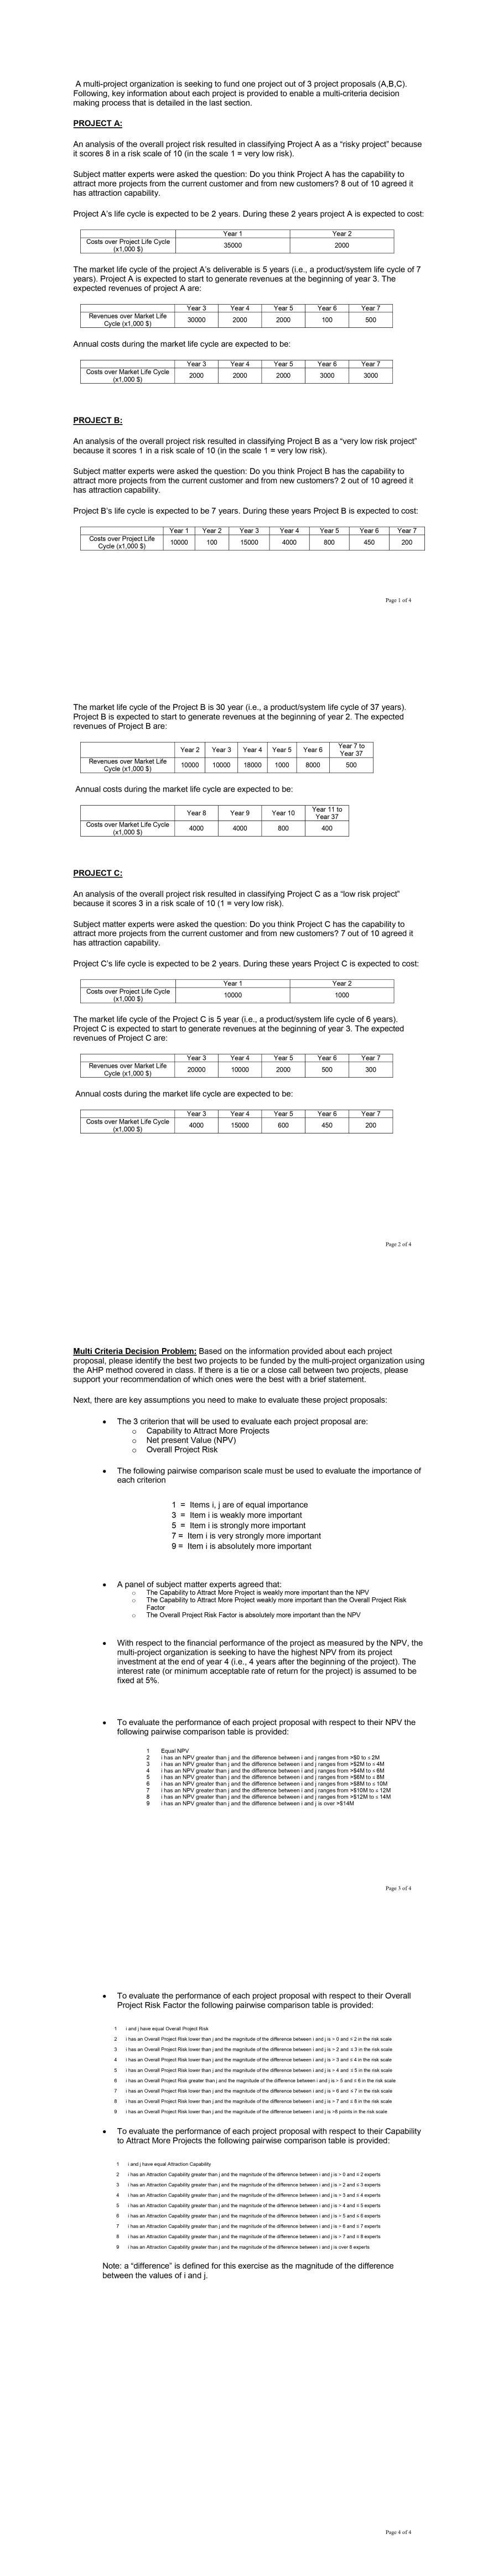
The market life cycle of the Project B is 30 year (i.e., a product/system life cycle of 37 years). Project B is expected to start to generate revenues at the beginning of year 2 . The expected revenues of Project B are: \begin{tabular}{|c|c|c|c|c|c|c|} \hline & Year 2 & Year 3 & Year 4 & Year 5 & Year 6 & Year 7 to Year 37 \\ \hline Revenues over Market Life Cycle (x1,000$) & 10000 & 10000 & 18000 & 1000 & 8000 & 500 \\ \hline \end{tabular} Annual costs during the market life cycle are expected to be: \begin{tabular}{|c|c|c|c|c|} \hline & Year 8 & Year 9 & Year 10 & Year 11 to Year 37 \\ \hline Costs over Market Life Cycle (x1,000 S) & 4000 & 4000 & 800 & 400 \\ \hline \end{tabular} PROJECT C: An analysis of the overall project risk resulted in classifying Project C as a "low risk project" because it scores 3 in a risk scale of 10(1= very low risk). Subject matter experts were asked the question: Do you think Project C has the capability to attract more projects from the current customer and from new customers? 7 out of 10 agreed it has attraction capability. Project C's life cycle is expected to be 2 years. During these years Project C is expected to cost: \begin{tabular}{|c|c|c|} \hline & Year 1 & Year 2 \\ \hline Costs over Project Life Cycle (x1,000$) & 10000 & 1000 \\ \hline \end{tabular} The market life cycle of the Project C is 5 year (i.e., a product/system life cycle of 6 years). Project C is expected to start to generate revenues at the beginning of year 3 . The expected revenues of Project C are: \begin{tabular}{|c|c|c|c|c|c|} \hline & Year 3 & Year 4 & Year 5 & Year 6 & Year 7 \\ \hline Revenues over Market Life Cycle (1,000$) & 20000 & 10000 & 2000 & 500 & 300 \\ \hline \end{tabular} Annual costs during the market life cycle are expected to be: \begin{tabular}{|c|c|c|c|c|c|} \hline & Year 3 & Year 4 & Year 5 & Year 6 & Year 7 \\ \hline Costs over Market Life Cycle (x1,000$) & 4000 & 15000 & 600 & 450 & 200 \\ \hline \end{tabular} The market life cycle of the Project B is 30 year (i.e., a product/system life cycle of 37 years). Project B is expected to start to generate revenues at the beginning of year 2 . The expected revenues of Project B are: \begin{tabular}{|c|c|c|c|c|c|c|} \hline & Year 2 & Year 3 & Year 4 & Year 5 & Year 6 & Year 7 to Year 37 \\ \hline Revenues over Market Life Cycle (x1,000$) & 10000 & 10000 & 18000 & 1000 & 8000 & 500 \\ \hline \end{tabular} Annual costs during the market life cycle are expected to be: \begin{tabular}{|c|c|c|c|c|} \hline & Year 8 & Year 9 & Year 10 & Year 11 to Year 37 \\ \hline Costs over Market Life Cycle (x1,000 S) & 4000 & 4000 & 800 & 400 \\ \hline \end{tabular} PROJECT C: An analysis of the overall project risk resulted in classifying Project C as a "low risk project" because it scores 3 in a risk scale of 10(1= very low risk). Subject matter experts were asked the question: Do you think Project C has the capability to attract more projects from the current customer and from new customers? 7 out of 10 agreed it has attraction capability. Project C's life cycle is expected to be 2 years. During these years Project C is expected to cost: \begin{tabular}{|c|c|c|} \hline & Year 1 & Year 2 \\ \hline Costs over Project Life Cycle (x1,000$) & 10000 & 1000 \\ \hline \end{tabular} The market life cycle of the Project C is 5 year (i.e., a product/system life cycle of 6 years). Project C is expected to start to generate revenues at the beginning of year 3 . The expected revenues of Project C are: \begin{tabular}{|c|c|c|c|c|c|} \hline & Year 3 & Year 4 & Year 5 & Year 6 & Year 7 \\ \hline Revenues over Market Life Cycle (1,000$) & 20000 & 10000 & 2000 & 500 & 300 \\ \hline \end{tabular} Annual costs during the market life cycle are expected to be: \begin{tabular}{|c|c|c|c|c|c|} \hline & Year 3 & Year 4 & Year 5 & Year 6 & Year 7 \\ \hline Costs over Market Life Cycle (x1,000$) & 4000 & 15000 & 600 & 450 & 200 \\ \hline \end{tabular}