

Question
The math and writing scores for a sample of 12 students who took the SAT are in the attached file. Test for a difference between
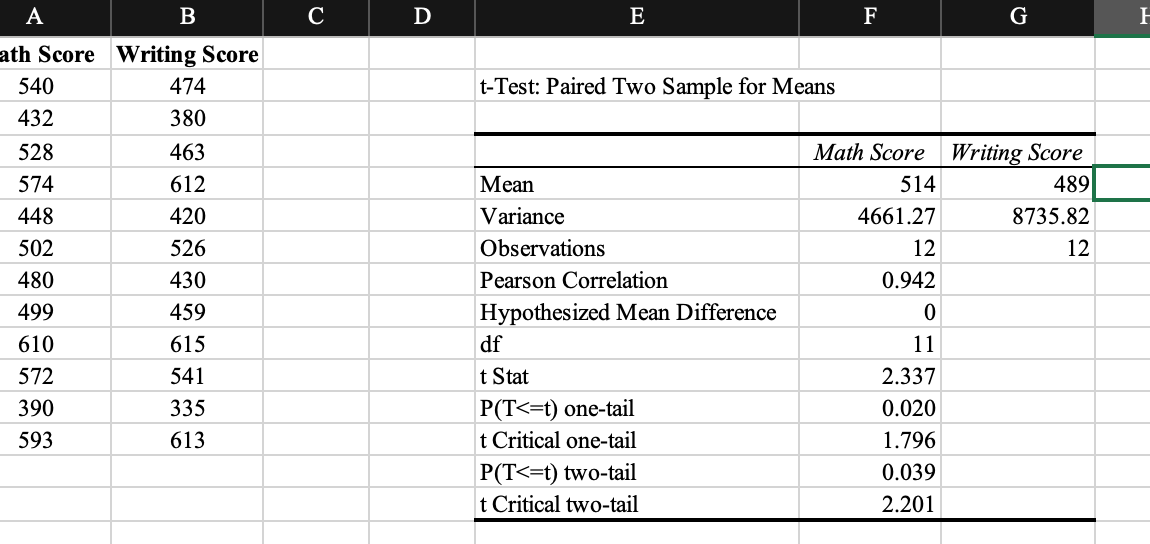 The math and writing scores for a sample of 12 students who took the SAT are in the attached file. Test for a difference between the population mean for the math scores and the population mean for the writing scores. What is the appropriate conclusion?
The Math scores are higher than the Writing scores but the difference is not statistically significant at a .01 level of significance.The Math scores are higher than the Writing scores but the difference is not statistically significant at a .05 level of significance. The Writing scores are higher than the Math scores and the difference is statistically significant at a .05 level of significance.The Math scores are higher than the Writing scores and the difference is statistically significant at a .01 level of significance.
Math Score Writing Score 540 474 432 380 528 463 574 612 448 420 502 526 480 430 499 459 610 615 572 541 390 335 593 613
t-Test: Paired Two Sample for Means Math Score Writing Score Mean 514 489 Variance 4661.27 8735.82 Observations 12 12 Pearson Correlation 0.942 Hypothesized Mean Difference 0 df 11 t Stat 2.337 P(T A B C D E F G I ath Score Writing Score 540 474 432 380 t-Test: Paired Two Sample for Means 528 574 448 502 480 499 610 572 390 593 463 612 420 526 430 459 615 541 335 613 Mean Variance Observations Pearson Correlation Hypothesized Mean Difference df t Stat P(T
Step by Step Solution
There are 3 Steps involved in it
Step: 1

Get Instant Access to Expert-Tailored Solutions
See step-by-step solutions with expert insights and AI powered tools for academic success
Step: 2

Step: 3
Ace Your Homework with AI
Get the answers you need in no time with our AI-driven, step-by-step assistance
Get Started
Finance Led Capitalism Shadow Banking Re Regulation And The Future Of Global Markets
Authors: Robert Guttmann
1st Edition
1137398566, 978-1137398567