

Answered step by step
Verified Expert Solution
Question
1 Approved Answer
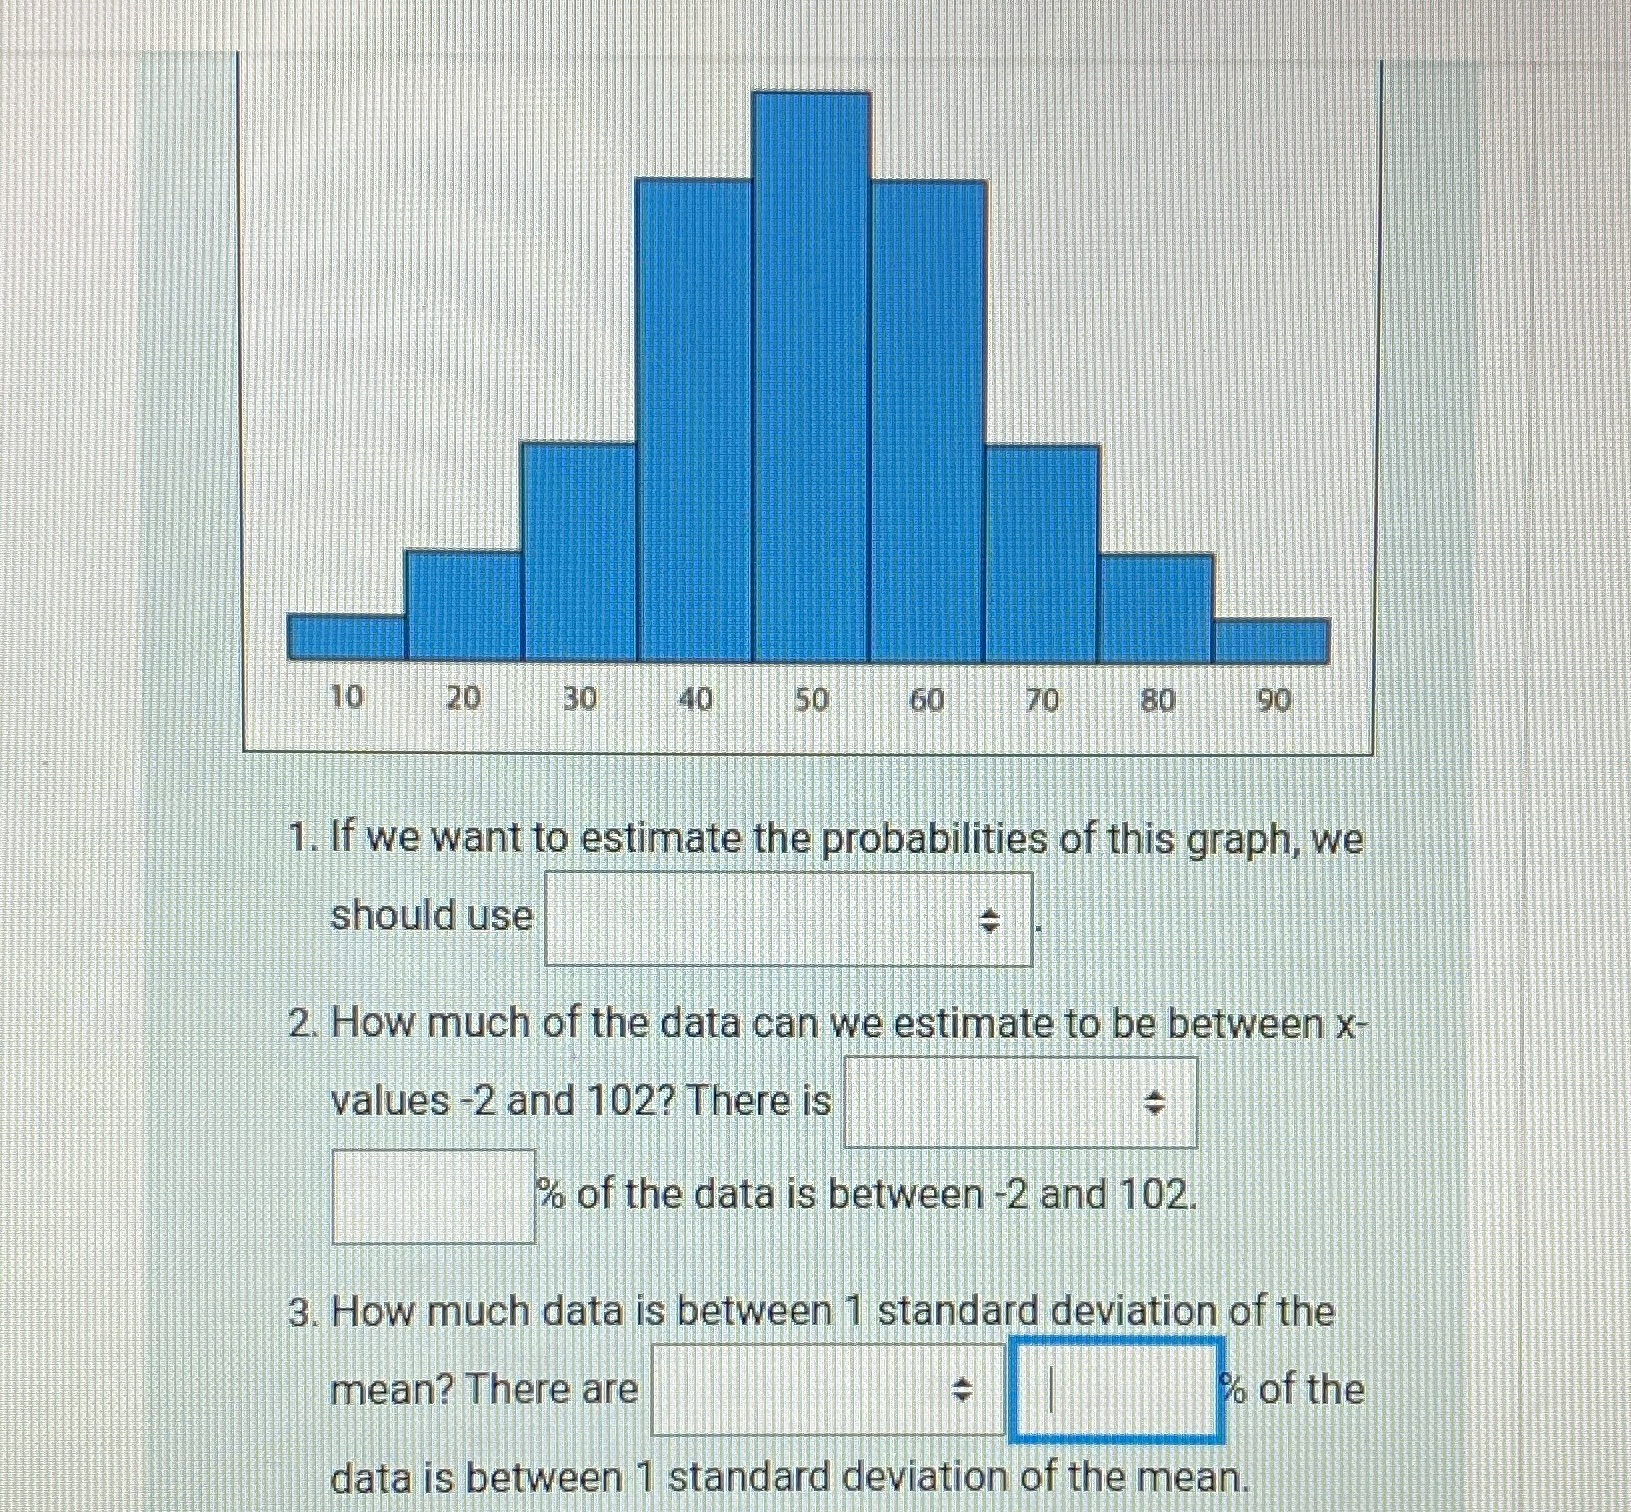
The mean is the data set is 50 and the standard deviation is 26. Can anyone help me? 10 20 30 40 50 60 70
The mean is the data set is 50 and the standard deviation is 26. Can anyone help me?
Step by Step Solution
There are 3 Steps involved in it
Step: 1

Get Instant Access to Expert-Tailored Solutions
See step-by-step solutions with expert insights and AI powered tools for academic success
Step: 2

Step: 3
Ace Your Homework with AI
Get the answers you need in no time with our AI-driven, step-by-step assistance
Get Started
Trigonometry, Enhanced
Authors: Cynthia Y Young
4th Edition
1119321131, 9781119321132