Answered step by step
Verified Expert Solution
Question
1 Approved Answer
The mean number of sick days an employee takes per year is believed to be about 10. Members of a personnel department do not


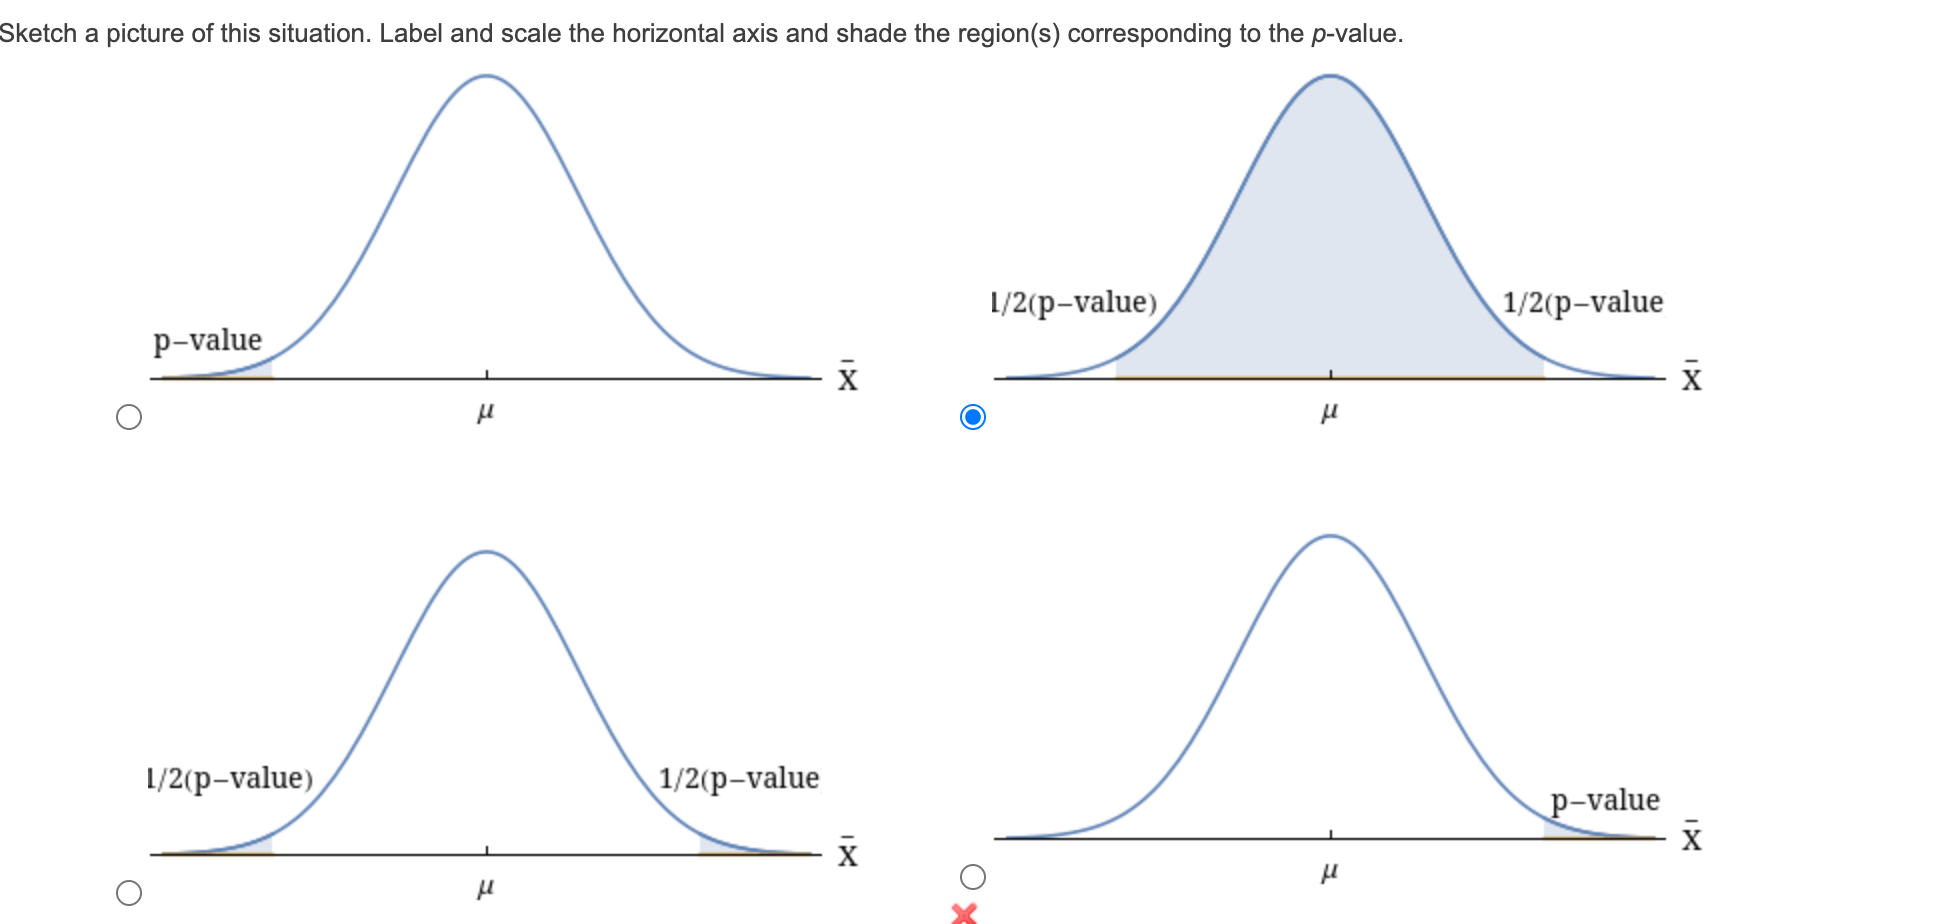
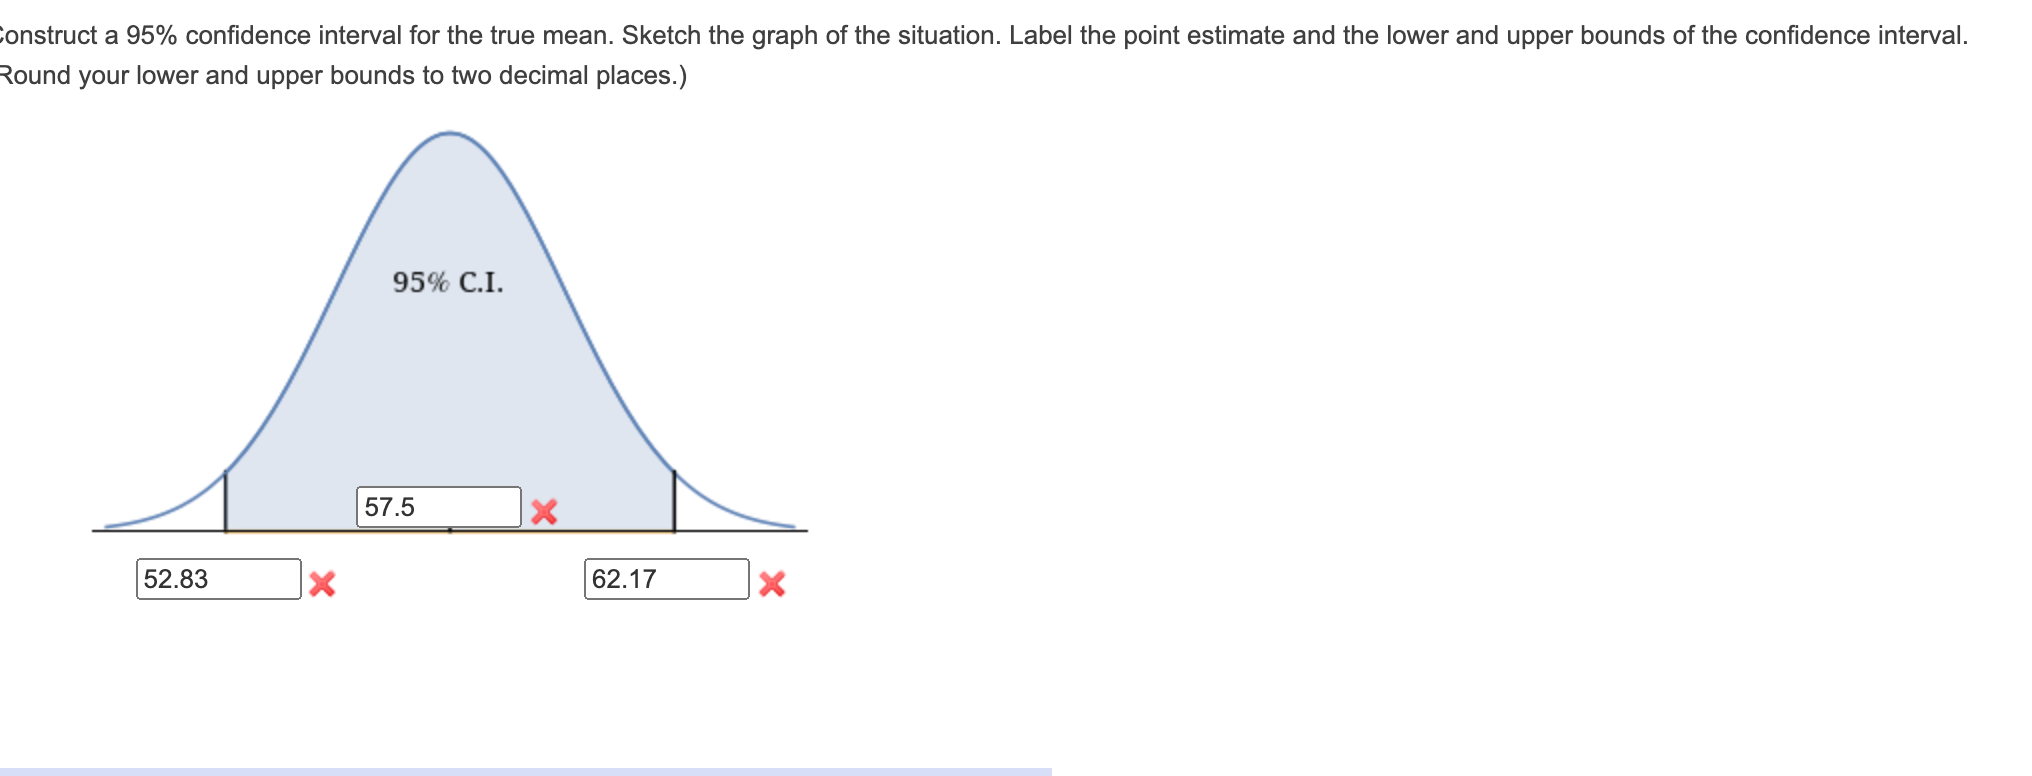
The mean number of sick days an employee takes per year is believed to be about 10. Members of a personnel department do not believe this figure. They randomly survey 8 employees. The number of sick days they took for the past year are as follows: 10; 6; 15; 3; 9; 8; 6; 9. Let X = the number of sick days they took for the past year. Should the personnel team believe that the mean number is about 10? Conduct a hypothesis test at the 5% level. Note: If you are using a Student's t-distribution for the problem, you may assume that the underlying population is normally distributed. (In general, you must first prove that assumption, though.) What is the test statistic? (If using the z distribution round your answers to two decimal places, and if using the t distribution round your answers to three decimal places.) =-0.957 t Part (f) What is the p-value? (Round your answer to four decimal places.) 0.3704 Sketch a picture of this situation. Label and scale the horizontal axis and shade the region(s) corresponding to the p-value. p-value 1/2(p-value) 1/2(p-value) 1/2(p-value 1/2(p-value 1 p-value Construct a 95% confidence interval for the true mean. Sketch the graph of the situation. Label the point estimate and the lower and upper bounds of the confidence interval. (Round your answers to three decimal places.) 4.94 95% C.I. 8.375 11.81 The mean work week for engineers in a start-up company is believed to be about 60 hours. A newly hired engineer hopes that it's shorter. She asks 10 engineering friends in start-ups for the lengths of their mean work weeks. Based on the results that follow, should she count on the mean work week to be shorter than 60 hours? Conduct a hypothesis test at the 5% level. Data (length of average work week): 70; 45; 55; 65; 65; 55; 55; 55; 50; 55. Note: If you are using a Student's t-distribution for the problem, you may assume that the underlying population is normally distributed. (In general, you must first prove that assumption, though.) Part (e) What is the test statistic? (If using the z distribution round your answers to two decimal places, and if using the t distribution round your answers to three decimal places.) t = -1.048 Port (F) Part (f) What is the p-value? (Round your answer to four decimal places.) 0.5193 Construct a 95% confidence interval for the true mean. Sketch the graph of the situation. Label the point estimate and the lower and upper bounds of the confidence interval. Round your lower and upper bounds to two decimal places.) 52.83 95% C.I. 57.5 62.17
Step by Step Solution
There are 3 Steps involved in it
Step: 1

Get Instant Access to Expert-Tailored Solutions
See step-by-step solutions with expert insights and AI powered tools for academic success
Step: 2

Step: 3

Ace Your Homework with AI
Get the answers you need in no time with our AI-driven, step-by-step assistance
Get Started


