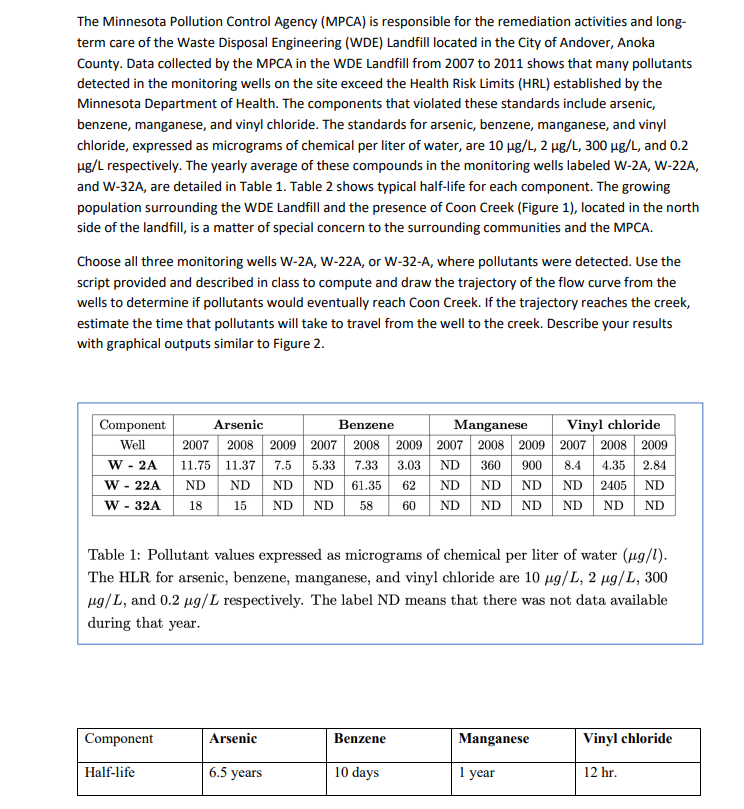
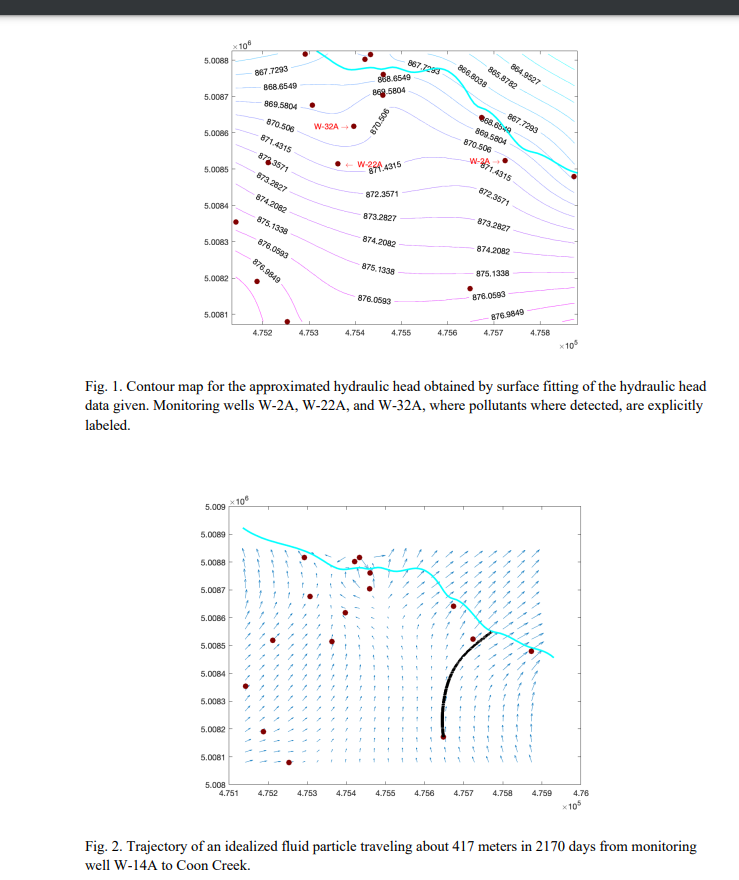
The Minnesota Pollution Control Agency (MPCA) is responsible for the remediation activities and long- term care of the Waste Disposal Engineering (WDE) Landfill located in the City of Andover, Anoka County. Data collected by the MPCA in the WDE Landfill from 2007 to 2011 shows that many pollutants detected in the monitoring wells on the site exceed the Health Risk Limits (HRL) established by the Minnesota Department of Health. The components that violated these standards include arsenic, benzene, manganese, and vinyl chloride. The standards for arsenic, benzene, manganese, and vinyl chloride, expressed as micrograms of chemical per liter of water, are 10 mg/L, 2 mg/L, 300 ug/, and 0.2 ug/L respectively. The yearly average of these compounds in the monitoring wells labeled W-2A, W-22A, and W-32A, are detailed in Table 1. Table 2 shows typical half-life for each component. The growing population surrounding the WDE Landfill and the presence of Coon Creek (Figure 1), located in the north side of the landfill, is a matter of special concern to the surrounding communities and the MPCA. Choose all three monitoring wells W-2A, W-22A, or W-32-A, where pollutants were detected. Use the script provided and described in class to compute and draw the trajectory of the flow curve from the wells to determine if pollutants would eventually reach Coon Creek. If the trajectory reaches the creek, estimate the time that pollutants will take to travel from the well to the creek. Describe your results with graphical outputs similar to Figure 2. Benzene Component Well W-2A W - 22A W - 32A Arsenic Manganese Vinyl chloride 2007 2008 2009 2007 2008 2009 2007 2008 2009 2007 2008 2009 11.75 11.37 7.5 5.33 7.33 3.03 ND 360 900 8.4 4.35 2.84 ND ND ND ND 61.35 62 ND ND ND ND 2405 ND 18 15 ND ND 58 60 ND ND ND ND ND ND Table 1: Pollutant values expressed as micrograms of chemical per liter of water (ug/l). The HLR for arsenic, benzene, manganese, and vinyl chloride are 10 ug/L, 2 ug/L, 300 ug/L, and 0.2 ug/L respectively. The label ND means that there was not data available during that year. Component Arsenic Benzene Manganese Vinyl chloride Half-life 6.5 years 10 days 1 year 12 hr. 10 5.00BB 866.8088 864.9527 865.8762 867.7293 888.6549 868 6549 869 5804 5.0087 869.5804 870.506 870.506 867.7293 W-32A. 668.6569 869.5804 5.0086 871.4315 870.506 872 3571 71.4315 5.0085 71.4315 873.2827 872.3571 872,3571 5.0084 874.2002 875.1 878.0593 873.2827 873.2827 5.0083 874.2002 874.2002 876.984 875.1338 875, 1338 5.0082 876.0693 876.0593 5.0081 B76.9849 4.752 4.753 4.754 4.755 4.756 4.757 4.758 10% Fig. 1. Contour map for the approximated hydraulic head obtained by surface fitting of the hydraulic head data given. Monitoring wells W-2A, W-22A, and W-32A, where pollutants where detected, are explicitly labeled 10 5.009 5.0089 5.0088 5.0087 5.0086- 5.0085 5.0084 5.0063 5.0062 5.0081 5.000 4.751 4.752 4.753 4.754 4.755 4.756 4.757 4.758 4.759 4.78 x 10⁵ Fig. 2. Trajectory of an idealized fluid particle traveling about 417 meters in 2170 days from monitoring well W-14A to Coon Creek. The Minnesota Pollution Control Agency (MPCA) is responsible for the remediation activities and long- term care of the Waste Disposal Engineering (WDE) Landfill located in the City of Andover, Anoka County. Data collected by the MPCA in the WDE Landfill from 2007 to 2011 shows that many pollutants detected in the monitoring wells on the site exceed the Health Risk Limits (HRL) established by the Minnesota Department of Health. The components that violated these standards include arsenic, benzene, manganese, and vinyl chloride. The standards for arsenic, benzene, manganese, and vinyl chloride, expressed as micrograms of chemical per liter of water, are 10 mg/L, 2 mg/L, 300 ug/, and 0.2 ug/L respectively. The yearly average of these compounds in the monitoring wells labeled W-2A, W-22A, and W-32A, are detailed in Table 1. Table 2 shows typical half-life for each component. The growing population surrounding the WDE Landfill and the presence of Coon Creek (Figure 1), located in the north side of the landfill, is a matter of special concern to the surrounding communities and the MPCA. Choose all three monitoring wells W-2A, W-22A, or W-32-A, where pollutants were detected. Use the script provided and described in class to compute and draw the trajectory of the flow curve from the wells to determine if pollutants would eventually reach Coon Creek. If the trajectory reaches the creek, estimate the time that pollutants will take to travel from the well to the creek. Describe your results with graphical outputs similar to Figure 2. Benzene Component Well W-2A W - 22A W - 32A Arsenic Manganese Vinyl chloride 2007 2008 2009 2007 2008 2009 2007 2008 2009 2007 2008 2009 11.75 11.37 7.5 5.33 7.33 3.03 ND 360 900 8.4 4.35 2.84 ND ND ND ND 61.35 62 ND ND ND ND 2405 ND 18 15 ND ND 58 60 ND ND ND ND ND ND Table 1: Pollutant values expressed as micrograms of chemical per liter of water (ug/l). The HLR for arsenic, benzene, manganese, and vinyl chloride are 10 ug/L, 2 ug/L, 300 ug/L, and 0.2 ug/L respectively. The label ND means that there was not data available during that year. Component Arsenic Benzene Manganese Vinyl chloride Half-life 6.5 years 10 days 1 year 12 hr. 10 5.00BB 866.8088 864.9527 865.8762 867.7293 888.6549 868 6549 869 5804 5.0087 869.5804 870.506 870.506 867.7293 W-32A. 668.6569 869.5804 5.0086 871.4315 870.506 872 3571 71.4315 5.0085 71.4315 873.2827 872.3571 872,3571 5.0084 874.2002 875.1 878.0593 873.2827 873.2827 5.0083 874.2002 874.2002 876.984 875.1338 875, 1338 5.0082 876.0693 876.0593 5.0081 B76.9849 4.752 4.753 4.754 4.755 4.756 4.757 4.758 10% Fig. 1. Contour map for the approximated hydraulic head obtained by surface fitting of the hydraulic head data given. Monitoring wells W-2A, W-22A, and W-32A, where pollutants where detected, are explicitly labeled 10 5.009 5.0089 5.0088 5.0087 5.0086- 5.0085 5.0084 5.0063 5.0062 5.0081 5.000 4.751 4.752 4.753 4.754 4.755 4.756 4.757 4.758 4.759 4.78 x 10⁵ Fig. 2. Trajectory of an idealized fluid particle traveling about 417 meters in 2170 days from monitoring well W-14A to Coon Creek