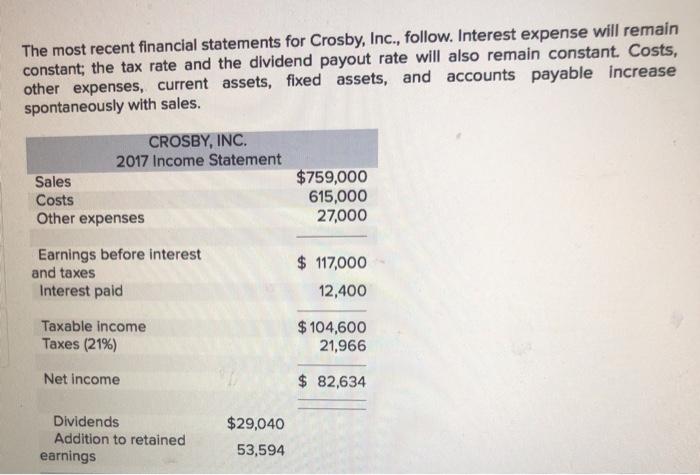
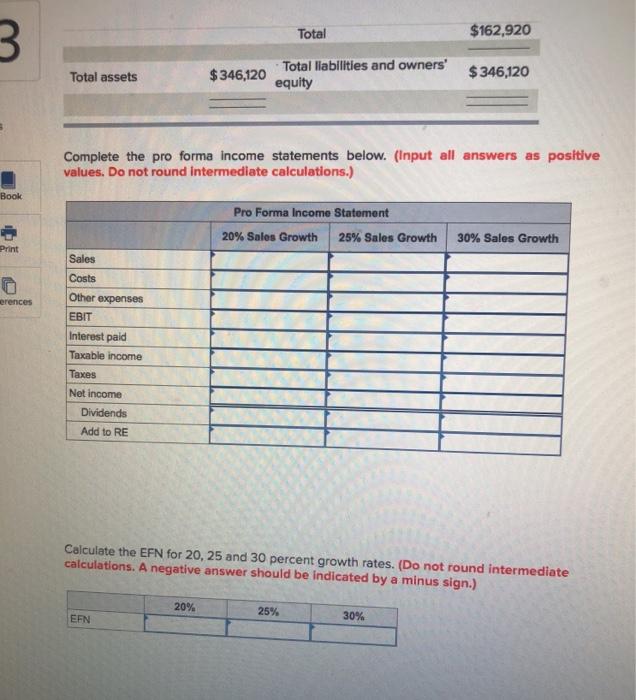
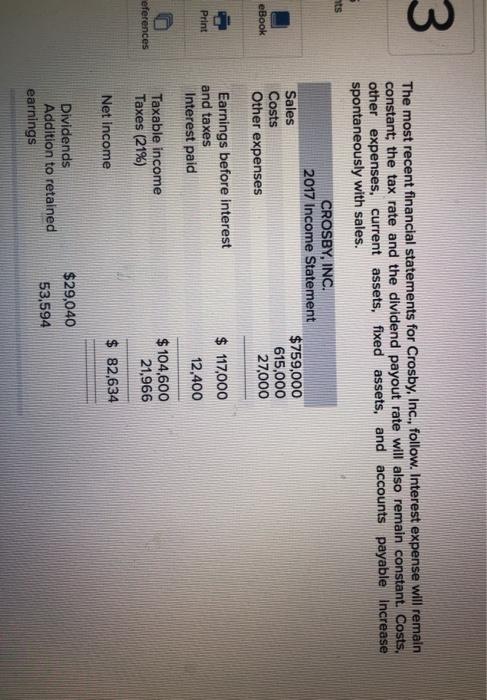
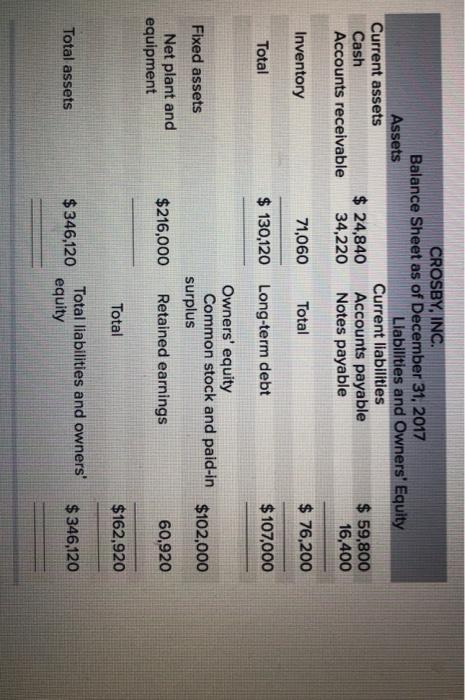
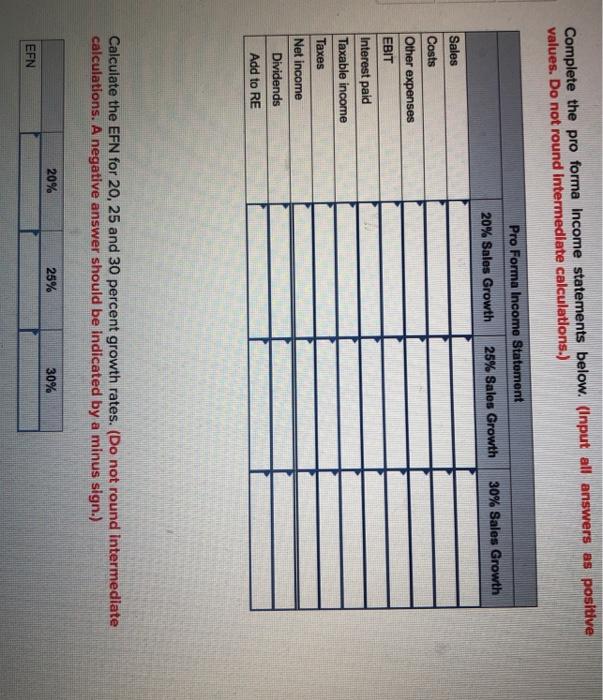
The most recent financial statements for Crosby, Inc., follow. Interest expense will remain constant; the tax rate and the dividend payout rate will also remain constant. Costs, other expenses, current assets, fixed assets, and accounts payable Increase spontaneously with sales. CROSBY, INC. 2017 Income Statement Sales Costs Other expenses Earnings before interest and taxes Interest paid $759,000 615,000 27,000 $ 117,000 12,400 Taxable income Taxes (21%) Net income $104,600 21,966 $ 82,634 $29,040 Dividends Addition to retained earnings 53,594 Total $162,920 3 Total assets $346,120 Total liabilities and owners' equity $ 346,120 Complete the pro forma income statements below. (Input all answers as positive values. Do not round Intermediate calculations.) Book Pro Forma Income Statement 20% Sales Growth 25% Sales Growth 30% Sales Growth Print Sales erences Costs Other expenses EBIT Interest paid Taxable income Taxes Net income Dividends Add to RE Calculate the EFN for 20, 25 and 30 percent growth rates. (Do not round intermediate calculations. A negative answer should be indicated by a minus sign.) 20% 25% EFN 30% 3 The most recent financial statements for Crosby, Inc., follow. Interest expense will remain constant; the tax rate and the dividend payout rate will also remain constant. Costs, other expenses, current assets, fixed assets, and accounts payable Increase spontaneously with sales. hts CROSBY, INC. 2017 Income Statement Sales Costs Other expenses $759,000 615,000 27,000 eBook Print Earnings before interest and taxes Interest paid $ 117,000 12,400 Taxable income Taxes (21%) $104,600 21,966 eferences Net Income $ 82,634 Dividends Addition to retained earnings $29,040 53,594 CROSBY, INC. Balance Sheet as of December 31, 2017 Assets Liabilities and Owners' Equity Current assets Current liabilities Cash $ 24,840 Accounts payable $ 59,800 Accounts receivable 34,220 Notes payable 16,400 Inventory 71,060 Total $ 76,200 Total $ 130,120 Long-term debt $ 107,000 Fixed assets Owners' equity Common stock and paid-in surplus Retained earnings $102,000 Net plant and equipment $216,000 60,920 Total $162,920 Total assets $346,120 Total liabilities and owners' equity $346,120 Complete the pro forma income statements below. (Input all answers as positive values. Do not round Intermediate calculations.) Pro Forma Income Statement 30% Sales Growth 25% Sales Growth 20% Sales Growth Sales Costs Other expenses EBIT Interest paid Taxable income Taxes Net income Dividends Add to RE Calculate the EFN for 20, 25 and 30 percent growth rates. (Do not round Intermediate calculations. A negative answer should be indicated by a minus sign.) 20% 25% 30% EFN The most recent financial statements for Crosby, Inc., follow. Interest expense will remain constant; the tax rate and the dividend payout rate will also remain constant. Costs, other expenses, current assets, fixed assets, and accounts payable Increase spontaneously with sales. CROSBY, INC. 2017 Income Statement Sales Costs Other expenses Earnings before interest and taxes Interest paid $759,000 615,000 27,000 $ 117,000 12,400 Taxable income Taxes (21%) Net income $104,600 21,966 $ 82,634 $29,040 Dividends Addition to retained earnings 53,594 Total $162,920 3 Total assets $346,120 Total liabilities and owners' equity $ 346,120 Complete the pro forma income statements below. (Input all answers as positive values. Do not round Intermediate calculations.) Book Pro Forma Income Statement 20% Sales Growth 25% Sales Growth 30% Sales Growth Print Sales erences Costs Other expenses EBIT Interest paid Taxable income Taxes Net income Dividends Add to RE Calculate the EFN for 20, 25 and 30 percent growth rates. (Do not round intermediate calculations. A negative answer should be indicated by a minus sign.) 20% 25% EFN 30% 3 The most recent financial statements for Crosby, Inc., follow. Interest expense will remain constant; the tax rate and the dividend payout rate will also remain constant. Costs, other expenses, current assets, fixed assets, and accounts payable Increase spontaneously with sales. hts CROSBY, INC. 2017 Income Statement Sales Costs Other expenses $759,000 615,000 27,000 eBook Print Earnings before interest and taxes Interest paid $ 117,000 12,400 Taxable income Taxes (21%) $104,600 21,966 eferences Net Income $ 82,634 Dividends Addition to retained earnings $29,040 53,594 CROSBY, INC. Balance Sheet as of December 31, 2017 Assets Liabilities and Owners' Equity Current assets Current liabilities Cash $ 24,840 Accounts payable $ 59,800 Accounts receivable 34,220 Notes payable 16,400 Inventory 71,060 Total $ 76,200 Total $ 130,120 Long-term debt $ 107,000 Fixed assets Owners' equity Common stock and paid-in surplus Retained earnings $102,000 Net plant and equipment $216,000 60,920 Total $162,920 Total assets $346,120 Total liabilities and owners' equity $346,120 Complete the pro forma income statements below. (Input all answers as positive values. Do not round Intermediate calculations.) Pro Forma Income Statement 30% Sales Growth 25% Sales Growth 20% Sales Growth Sales Costs Other expenses EBIT Interest paid Taxable income Taxes Net income Dividends Add to RE Calculate the EFN for 20, 25 and 30 percent growth rates. (Do not round Intermediate calculations. A negative answer should be indicated by a minus sign.) 20% 25% 30% EFN