The needed question's solution is 2.13 and 2.9 is a reference
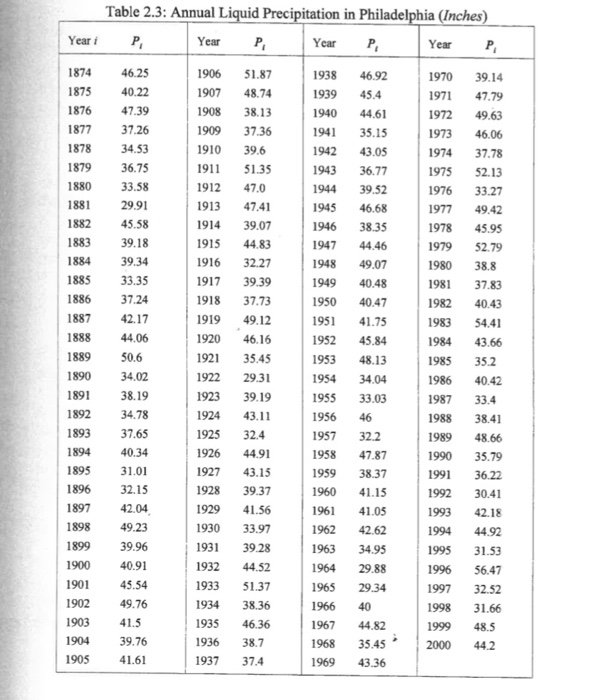
2.13From the Precipitation data at various durations given in Example 2.9, (1) prepare the IDF curves for the 2-year and 3-year return periods; (2) using these curves, estimate the design rainfall intensity corresponding to a 2-year return period and a duration of 12 hour; (3) estimate the design precipitation intensity of a nearby facility if the required return period is T=2.33years (considered the mean annual event), and the critical duration is. 2.9 Modify the Maple program of Example 2.5 to produce a single graph with 10, 20, and 30-year moving average curves of annual precipitation in Philadelphia. The data file can be downloaded from the Franklin Institute site (www.fi.edu/weather/data2/index.html). State your conclusions about the effect of different durations in moving averages. Year i 1874 1875 1876 1877 1878 1879 1880 1881 1882 1883 1884 1885 1886 1887 1888 1889 1890 1891 1892 1893 1894 1895 1896 1897 1898 1899 1900 1901 1902 1903 1904 1905 Table 2.3: Annual Liquid Precipitation in Philadelphia (Inches) P, Year P, Year P, Year P. 46.25 1906 51.87 1938 46.92 1970 39.14 40.22 1907 48.74 1939 45.4 1971 47.79 47.39 1908 38.13 1940 44.61 1972 49.63 37.26 1909 37.36 1941 35.15 1973 46.06 34.53 1910 39.6 1942 43.05 1974 37.78 36.75 1911 51.35 1943 36.77 1975 52.13 33.58 1912 47.0 1944 39.52 1976 33.27 29.91 1913 47.41 1945 46.68 1977 49.42 45.58 1914 39.07 1946 38.35 1978 45.95 39.18 1915 44.83 1947 44.46 1979 52.79 39.34 1916 32.27 1948 49.07 1980 38.8 33.35 1917 39.39 1949 40.48 1981 37.83 37.24 1918 37.73 1950 40.47 1982 40.43 42.17 1919 49.12 1951 41.75 1983 54.41 44.06 1920 46.16 1952 45.84 1984 43.66 1921 35.45 1953 48.13 35.2 34.02 29.31 1954 34.04 1986 40.42 38.19 1923 39.19 1955 33.03 33.4 34.78 1924 43.11 1956 46 1988 38.41 37.65 1925 32.4 1957 32.2 1989 48.66 40.34 1926 44.91 1958 47.87 1990 35.79 31.01 1927 43.15 1959 38.37 1991 36.22 32.15 1928 39.37 1960 41.15 1992 30.41 42.04 1929 41.56 1961 41.05 1993 42.18 49.23 1930 33.97 1962 42.62 1994 44.92 39.96 1931 39.28 1963 34.95 1995 31.53 40.91 1932 44.52 1964 29.88 1996 56.47 45.54 1933 51.37 1965 29.34 1997 32.52 49.76 1934 38.36 1966 40 1998 31.66 41.5 1935 46.36 1967 44.82 1999 48.5 39.76 1936 38.7 1968 35.45 2000 44.2 41.61 1937 37.4 1969 43.36 50.6 1985 1922 1987 2.13From the Precipitation data at various durations given in Example 2.9, (1) prepare the IDF curves for the 2-year and 3-year return periods; (2) using these curves, estimate the design rainfall intensity corresponding to a 2-year return period and a duration of 12 hour; (3) estimate the design precipitation intensity of a nearby facility if the required return period is T=2.33years (considered the mean annual event), and the critical duration is. 2.9 Modify the Maple program of Example 2.5 to produce a single graph with 10, 20, and 30-year moving average curves of annual precipitation in Philadelphia. The data file can be downloaded from the Franklin Institute site (www.fi.edu/weather/data2/index.html). State your conclusions about the effect of different durations in moving averages. Year i 1874 1875 1876 1877 1878 1879 1880 1881 1882 1883 1884 1885 1886 1887 1888 1889 1890 1891 1892 1893 1894 1895 1896 1897 1898 1899 1900 1901 1902 1903 1904 1905 Table 2.3: Annual Liquid Precipitation in Philadelphia (Inches) P, Year P, Year P, Year P. 46.25 1906 51.87 1938 46.92 1970 39.14 40.22 1907 48.74 1939 45.4 1971 47.79 47.39 1908 38.13 1940 44.61 1972 49.63 37.26 1909 37.36 1941 35.15 1973 46.06 34.53 1910 39.6 1942 43.05 1974 37.78 36.75 1911 51.35 1943 36.77 1975 52.13 33.58 1912 47.0 1944 39.52 1976 33.27 29.91 1913 47.41 1945 46.68 1977 49.42 45.58 1914 39.07 1946 38.35 1978 45.95 39.18 1915 44.83 1947 44.46 1979 52.79 39.34 1916 32.27 1948 49.07 1980 38.8 33.35 1917 39.39 1949 40.48 1981 37.83 37.24 1918 37.73 1950 40.47 1982 40.43 42.17 1919 49.12 1951 41.75 1983 54.41 44.06 1920 46.16 1952 45.84 1984 43.66 1921 35.45 1953 48.13 35.2 34.02 29.31 1954 34.04 1986 40.42 38.19 1923 39.19 1955 33.03 33.4 34.78 1924 43.11 1956 46 1988 38.41 37.65 1925 32.4 1957 32.2 1989 48.66 40.34 1926 44.91 1958 47.87 1990 35.79 31.01 1927 43.15 1959 38.37 1991 36.22 32.15 1928 39.37 1960 41.15 1992 30.41 42.04 1929 41.56 1961 41.05 1993 42.18 49.23 1930 33.97 1962 42.62 1994 44.92 39.96 1931 39.28 1963 34.95 1995 31.53 40.91 1932 44.52 1964 29.88 1996 56.47 45.54 1933 51.37 1965 29.34 1997 32.52 49.76 1934 38.36 1966 40 1998 31.66 41.5 1935 46.36 1967 44.82 1999 48.5 39.76 1936 38.7 1968 35.45 2000 44.2 41.61 1937 37.4 1969 43.36 50.6 1985 1922 1987


