

Answered step by step
Verified Expert Solution
Question
1 Approved Answer
. The New York Stock Exchange (NYSE) is the largest capital market in the world. Because of its size the NYSE is continually evaluated to
.
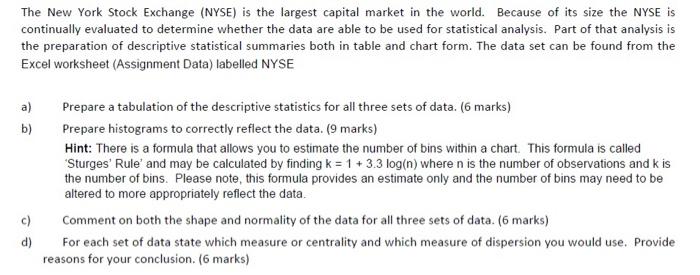
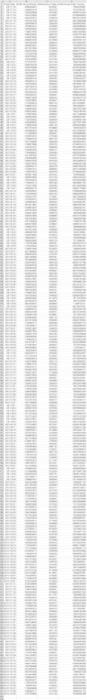
The New York Stock Exchange (NYSE) is the largest capital market in the world. Because of its size the NYSE is continually evaluated to determine whether the data are able to be used for statistical analysis. Part of that analysis is the preparation of descriptive statistical summaries both in table and chart form. The data set can be found from the Excel worksheet (Assignment Data) labelled NYSE a) b) Prepare a tabulation of the descriptive statistics for all three sets of data. (6 marks) Prepare histograms to correctly reflect the data. (9 marks) Hint: There is a formula that allows you to estimate the number of bins within a chart. This formula is called "Sturges' Rule' and may be calculated by finding k = 1 +3.3 log(n) where n is the number of observations and k is the number of bins. Please note this formula provides an estimate only and the number of bins may need to be altered to more appropriately reflect the data Comment on both the shape and normality of the data for all three sets of data. (6 marks) For each set of data state which measure or centrality and which measure of dispersion you would use. Provide reasons for your conclusion. (6 marks) c) d) The New York Stock Exchange (NYSE) is the largest capital market in the world. Because of its size the NYSE is continually evaluated to determine whether the data are able to be used for statistical analysis. Part of that analysis is the preparation of descriptive statistical summaries both in table and chart form. The data set can be found from the Excel worksheet (Assignment Data) labelled NYSE a) b) Prepare a tabulation of the descriptive statistics for all three sets of data. (6 marks) Prepare histograms to correctly reflect the data. (9 marks) Hint: There is a formula that allows you to estimate the number of bins within a chart. This formula is called "Sturges' Rule' and may be calculated by finding k = 1 +3.3 log(n) where n is the number of observations and k is the number of bins. Please note this formula provides an estimate only and the number of bins may need to be altered to more appropriately reflect the data Comment on both the shape and normality of the data for all three sets of data. (6 marks) For each set of data state which measure or centrality and which measure of dispersion you would use. Provide reasons for your conclusion. (6 marks) c) d) Step by Step Solution
There are 3 Steps involved in it
Step: 1

Get Instant Access to Expert-Tailored Solutions
See step-by-step solutions with expert insights and AI powered tools for academic success
Step: 2

Step: 3
Ace Your Homework with AI
Get the answers you need in no time with our AI-driven, step-by-step assistance
Get Started
The Future Of Financea The LSE Report
Authors: Chairman Adair Turner, Paul Woolley, Andrew Dr Haldane, Richard Layard, Andrew G. Haldane, Paul Wooley
1st Edition
085328458X, 978-0853284581