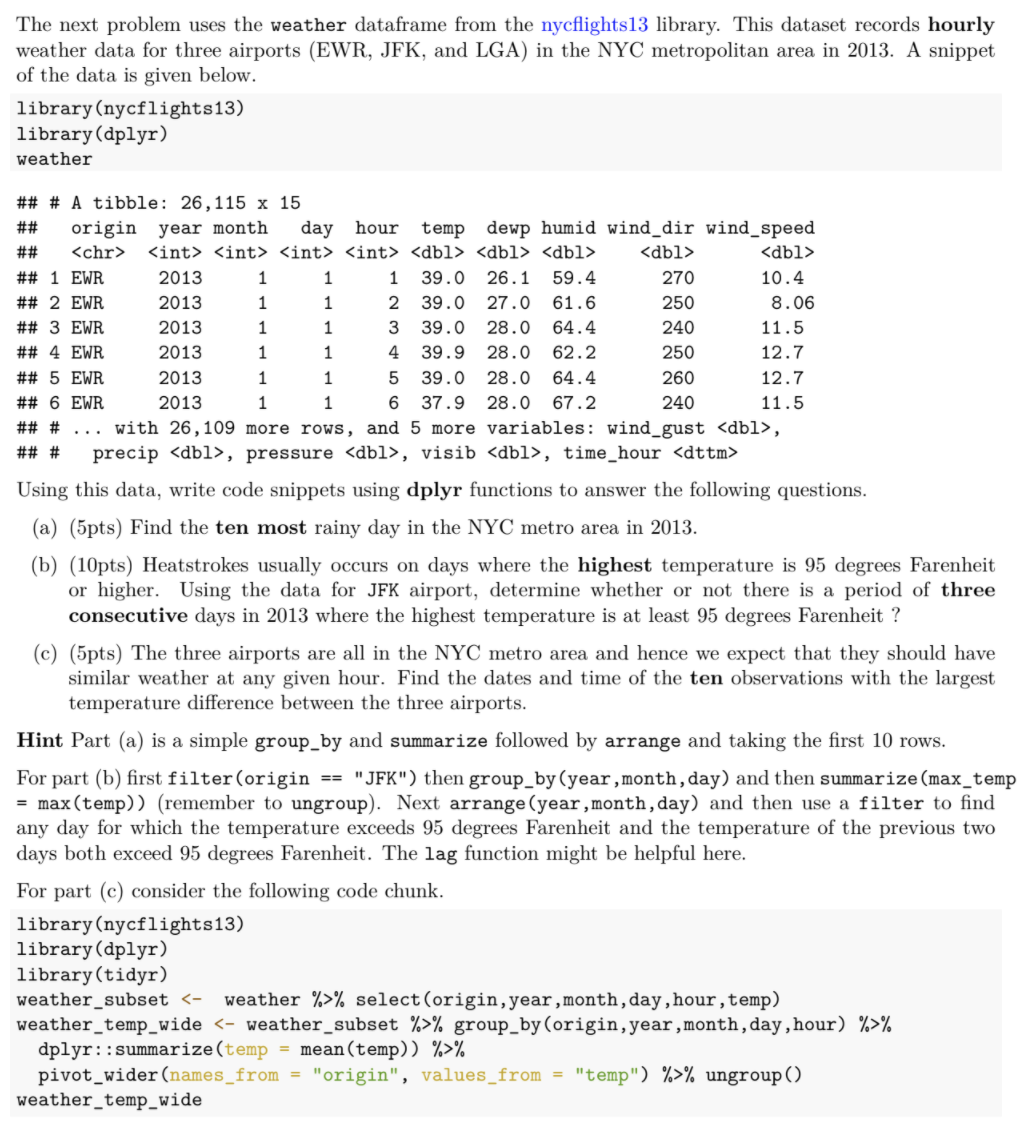
The next problem uses the weather dataframe from the nycflights13 library. This dataset records hourly weather data for three airports (EWR, JFK, and LGA) in the NYC metropolitan area in 2013. A snippet of the data is given below. library(nycflights13) library (dplyr) weather ## # A tibble: 26,115 x 15 ## origin year month day hour temp dewp humid wind_dir wind_speed ##
## 1 EWR 2013 1 1 1 39.0 26.1 59.4 270 10.4 ## 2 EWR 2013 1 1 2 39.0 27.0 61.6 250 8.06 ## 3 EWR 2013 1 1 3 39.0 28.0 64.4 240 11.5 ## 4 EWR 2013 1 1 4 39.9 28.0 62.2 250 12.7 ## 5 EWR 2013 1 1 5 39.0 28.0 64.4 260 12.7 ## 6 EWR 2013 1 1 6 37.9 28.0 67.2 240 11.5 ## # with 26, 109 more rows, and 5 more variables: wind_gust , ## # precip , pressure , visib , time_hour Using this data, write code snippets using dplyr functions to answer the following questions. (a) (5pts) Find the ten most rainy day in the NYC metro area in 2013. (b) (10pts) Heatstrokes usually occurs on days where the highest temperature is 95 degrees Farenheit or higher. Using the data for JFK airport, determine whether or not there is a period of three consecutive days in 2013 where the highest temperature is at least 95 degrees Farenheit ? (c) (5pts) The three airports are all in the NYC metro area and hence we expect that they should have similar weather at any given hour. Find the dates and time of the ten observations with the largest temperature difference between the three airports. Hint Part (a) is a simple group_by and summarize followed by arrange and taking the first 10 rows. For part (b) first filter(origin == "JFK") then group_by (year ,month, day) and then summarize (max_temp = max(temp)) (remember to ungroup). Next arrange (year,month,day) and then use a filter to find any day for which the temperature exceeds 95 degrees Farenheit and the temperature of the previous two days both exceed 95 degrees Farenheit. The lag function might be helpful here. For part (c) consider the following code chunk. library(nycflights13) library(dplyr) library(tidyr) weather_subset % select(origin, year,month,day , hour, temp) weather_temp_wide % group_by (origin, year, month,day , hour) %>% dplyr::summarize(temp = mean(temp)) %>% pivot_wider (names_from = "origin", values from = "temp") %>% ungroup() weather_temp_wide The next problem uses the weather dataframe from the nycflights13 library. This dataset records hourly weather data for three airports (EWR, JFK, and LGA) in the NYC metropolitan area in 2013. A snippet of the data is given below. library(nycflights13) library (dplyr) weather ## # A tibble: 26,115 x 15 ## origin year month day hour temp dewp humid wind_dir wind_speed ## ## 1 EWR 2013 1 1 1 39.0 26.1 59.4 270 10.4 ## 2 EWR 2013 1 1 2 39.0 27.0 61.6 250 8.06 ## 3 EWR 2013 1 1 3 39.0 28.0 64.4 240 11.5 ## 4 EWR 2013 1 1 4 39.9 28.0 62.2 250 12.7 ## 5 EWR 2013 1 1 5 39.0 28.0 64.4 260 12.7 ## 6 EWR 2013 1 1 6 37.9 28.0 67.2 240 11.5 ## # with 26, 109 more rows, and 5 more variables: wind_gust , ## # precip , pressure , visib , time_hour Using this data, write code snippets using dplyr functions to answer the following questions. (a) (5pts) Find the ten most rainy day in the NYC metro area in 2013. (b) (10pts) Heatstrokes usually occurs on days where the highest temperature is 95 degrees Farenheit or higher. Using the data for JFK airport, determine whether or not there is a period of three consecutive days in 2013 where the highest temperature is at least 95 degrees Farenheit ? (c) (5pts) The three airports are all in the NYC metro area and hence we expect that they should have similar weather at any given hour. Find the dates and time of the ten observations with the largest temperature difference between the three airports. Hint Part (a) is a simple group_by and summarize followed by arrange and taking the first 10 rows. For part (b) first filter(origin == "JFK") then group_by (year ,month, day) and then summarize (max_temp = max(temp)) (remember to ungroup). Next arrange (year,month,day) and then use a filter to find any day for which the temperature exceeds 95 degrees Farenheit and the temperature of the previous two days both exceed 95 degrees Farenheit. The lag function might be helpful here. For part (c) consider the following code chunk. library(nycflights13) library(dplyr) library(tidyr) weather_subset % select(origin, year,month,day , hour, temp) weather_temp_wide % group_by (origin, year, month,day , hour) %>% dplyr::summarize(temp = mean(temp)) %>% pivot_wider (names_from = "origin", values from = "temp") %>% ungroup() weather_temp_wide