

Answered step by step
Verified Expert Solution
Question
1 Approved Answer
the NPV Brazils inflation rate being volatile, perform sensitivity analyses on the inflation rate and discuss the viability of the investment based on the NPV.
the NPV 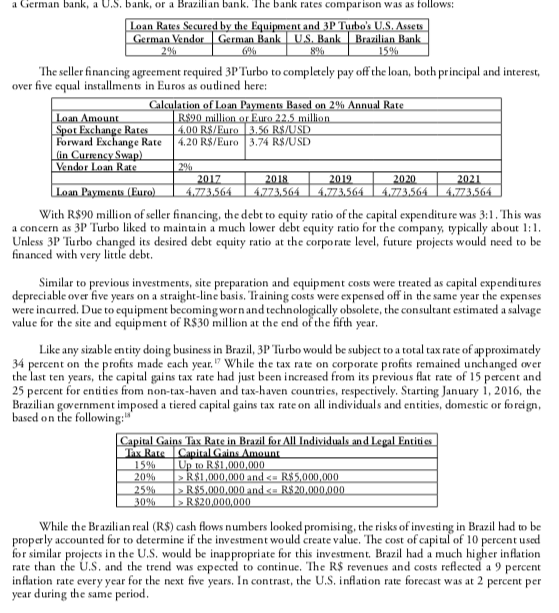
Brazils inflation rate being volatile, perform sensitivity analyses on the inflation rate and discuss the viability of the investment based on the NPV.
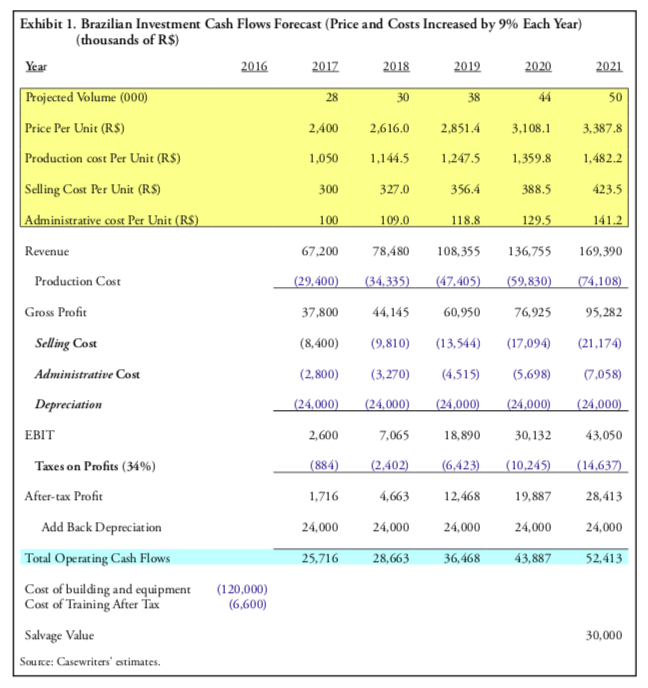
a German bank, a U.S. bank, or a Brazilian bank. The bank rates comparison was as follows: Loan Rates Secured by the Equipment and 3P Turbo's U.S. Assets German Vendor German Bank US Bank Brazilian Bank 2% 6% 8% 15% The seller financing agreement required 3P Turbo to completely pay off the loan, both principal and interest, over five equal installments in Euros as outlined here: Calculation of Loan Payments Based on 2% Annual Rate Loan Amount R$90 million or Euro 22.5 million Spot Exchange Rates 4,00 R$/Euro 3.56 R$/USD Forward Exchange Rate 4.20 R$/Euro 3.74 R$/USD in Currency Swap) Vendor Loan Rate 2% 2017 2018 2019 2020 2021 Loan Payments (Euro) 4.773,564 14.773,564 14.773,564 14.773,564 14.773,564 With R$90 million of seller financing, the debt to equity ratio of the capital expenditure was 3:1. This was a concern as 3P Turbo liked to maintain a much lower debt equity ratio for the company, typically about 1:1. Unless 3P Turbo changed its desired debt equity ratio at the corporate level, future projects would need to be financed with very little debt. Similar to previous investments, site preparation and equipment costs were treated as capital expenditures depreciable over five years on a straight-line basis. Training costs were expensed off in the same year the expenses were incurred. Due to equipment becoming worn and technologically obsolete, the consultant estimated a salvage value for the site and equipment of R$ 30 million at the end of the fifth year. Like any sizable entity doing business in Brazil, 3P Turbo would be subject to a total tax rate of approximately 34 percent on the profits made each year." While the tax rate on corporate profits remained unchanged over the last ten years, the capital gains tax rate had just been increased from its previous flat rate of 15 percent and 25 percent for entities from non-tax-haven and tax-haven countries, respectively. Starting January 1, 2016, the Brazilian government imposed a tiered capital gains tax rate on all individuals and entities, domestic or foreign, based on the following: Capital Gains Tax Rate in Brazil for All Individuals and Legal Entities Thx Rate Capital Gains. Amount 15% I Up to RS!.000.000 20% R$1.000.000 and R$5.000.000 25% R$5,000,000 and R$20,000,000 While the Brazilian real (R$) cash flows numbers looked promising, the risks of investing in Brazil had to be properly accounted for to determine if the investment would create value. The cost of capital of 10 percent used for similar projects in the U.S. would be inappropriate for this investment. Brazil had a much higher inflation rate than the U.S. and the trend was expected to continue. The R$ revenues and costs reflected a 9 percent inflation rate every year for the next five years. In contrast, the U.S. inflation rate forecast was at 2 percent per year during the same period. Exhibit 1. Brazilian Investment Cash Flows Forecast (Price and Costs Increased by 9% Each Year) (thousands of R$) Year 2016 2017 2018 2019 2020 2021 Projected Volume (000) 38 Price Per Unit (RS) 2,400 2,616. 0 2,851.4 3.108. 1 3,387.8 Production cost Per Unit (RS) 1,050 1,144.5 1,247.5 1,359.8 1,482.2 Selling Cost Per Unit (RS) 300 327.0 356.4 388.5 423.5 Administrative cost Per Unit (R$) 100 109.0 118.8 129.5 141.2 Revenue 67,200 78,480 108,355 136,755 169.390 Production Cost (29,400) (34,335) (47,405) (59,830) (74,108) Gross Profit 37,800 44,145 60,950 76,925 95,282 Selling Cost (8,400) (9,810) (17,094) (21,174) (13,544) (4,515) Administrative Cost (2,800) (3,270) (5,698) (7,058) Depreciation (24,000) (24.000) (24.000) (24.000) (24.000) EBIT 2,600 7,065 18,890 30,132 43,050 Taxes on Profits (34%) (884) (2.402) 6,423) (10,245) (14,637) After-tax Profit 1,716 4,663 12,468 19,887 28,413 Add Back Depreciation 24,000 24,000 24000 24000 24,000 Total Operating Cash Flows 25,716 28,663 36,468 43,887 52,413 Cost of building and equipment Cost of Training After Tax (120,000) (6,600) Salvage Value 30,000 Source: Casewriters' estimates. a German bank, a U.S. bank, or a Brazilian bank. The bank rates comparison was as follows: Loan Rates Secured by the Equipment and 3P Turbo's U.S. Assets German Vendor German Bank US Bank Brazilian Bank 2% 6% 8% 15% The seller financing agreement required 3P Turbo to completely pay off the loan, both principal and interest, over five equal installments in Euros as outlined here: Calculation of Loan Payments Based on 2% Annual Rate Loan Amount R$90 million or Euro 22.5 million Spot Exchange Rates 4,00 R$/Euro 3.56 R$/USD Forward Exchange Rate 4.20 R$/Euro 3.74 R$/USD in Currency Swap) Vendor Loan Rate 2% 2017 2018 2019 2020 2021 Loan Payments (Euro) 4.773,564 14.773,564 14.773,564 14.773,564 14.773,564 With R$90 million of seller financing, the debt to equity ratio of the capital expenditure was 3:1. This was a concern as 3P Turbo liked to maintain a much lower debt equity ratio for the company, typically about 1:1. Unless 3P Turbo changed its desired debt equity ratio at the corporate level, future projects would need to be financed with very little debt. Similar to previous investments, site preparation and equipment costs were treated as capital expenditures depreciable over five years on a straight-line basis. Training costs were expensed off in the same year the expenses were incurred. Due to equipment becoming worn and technologically obsolete, the consultant estimated a salvage value for the site and equipment of R$ 30 million at the end of the fifth year. Like any sizable entity doing business in Brazil, 3P Turbo would be subject to a total tax rate of approximately 34 percent on the profits made each year." While the tax rate on corporate profits remained unchanged over the last ten years, the capital gains tax rate had just been increased from its previous flat rate of 15 percent and 25 percent for entities from non-tax-haven and tax-haven countries, respectively. Starting January 1, 2016, the Brazilian government imposed a tiered capital gains tax rate on all individuals and entities, domestic or foreign, based on the following: Capital Gains Tax Rate in Brazil for All Individuals and Legal Entities Thx Rate Capital Gains. Amount 15% I Up to RS!.000.000 20% R$1.000.000 and R$5.000.000 25% R$5,000,000 and R$20,000,000 While the Brazilian real (R$) cash flows numbers looked promising, the risks of investing in Brazil had to be properly accounted for to determine if the investment would create value. The cost of capital of 10 percent used for similar projects in the U.S. would be inappropriate for this investment. Brazil had a much higher inflation rate than the U.S. and the trend was expected to continue. The R$ revenues and costs reflected a 9 percent inflation rate every year for the next five years. In contrast, the U.S. inflation rate forecast was at 2 percent per year during the same period. Exhibit 1. Brazilian Investment Cash Flows Forecast (Price and Costs Increased by 9% Each Year) (thousands of R$) Year 2016 2017 2018 2019 2020 2021 Projected Volume (000) 38 Price Per Unit (RS) 2,400 2,616. 0 2,851.4 3.108. 1 3,387.8 Production cost Per Unit (RS) 1,050 1,144.5 1,247.5 1,359.8 1,482.2 Selling Cost Per Unit (RS) 300 327.0 356.4 388.5 423.5 Administrative cost Per Unit (R$) 100 109.0 118.8 129.5 141.2 Revenue 67,200 78,480 108,355 136,755 169.390 Production Cost (29,400) (34,335) (47,405) (59,830) (74,108) Gross Profit 37,800 44,145 60,950 76,925 95,282 Selling Cost (8,400) (9,810) (17,094) (21,174) (13,544) (4,515) Administrative Cost (2,800) (3,270) (5,698) (7,058) Depreciation (24,000) (24.000) (24.000) (24.000) (24.000) EBIT 2,600 7,065 18,890 30,132 43,050 Taxes on Profits (34%) (884) (2.402) 6,423) (10,245) (14,637) After-tax Profit 1,716 4,663 12,468 19,887 28,413 Add Back Depreciation 24,000 24,000 24000 24000 24,000 Total Operating Cash Flows 25,716 28,663 36,468 43,887 52,413 Cost of building and equipment Cost of Training After Tax (120,000) (6,600) Salvage Value 30,000 Source: Casewriters' estimatesStep by Step Solution
There are 3 Steps involved in it
Step: 1

Get Instant Access to Expert-Tailored Solutions
See step-by-step solutions with expert insights and AI powered tools for academic success
Step: 2

Step: 3
Ace Your Homework with AI
Get the answers you need in no time with our AI-driven, step-by-step assistance
Get Started
The Handbook Of Mergers And Acquisitions
Authors: David Faulkner, Satu Teerikangas, Richard J. Joseph
1st Edition
0199601461, 978-0199601462