

Answered step by step
Verified Expert Solution
Question
1 Approved Answer
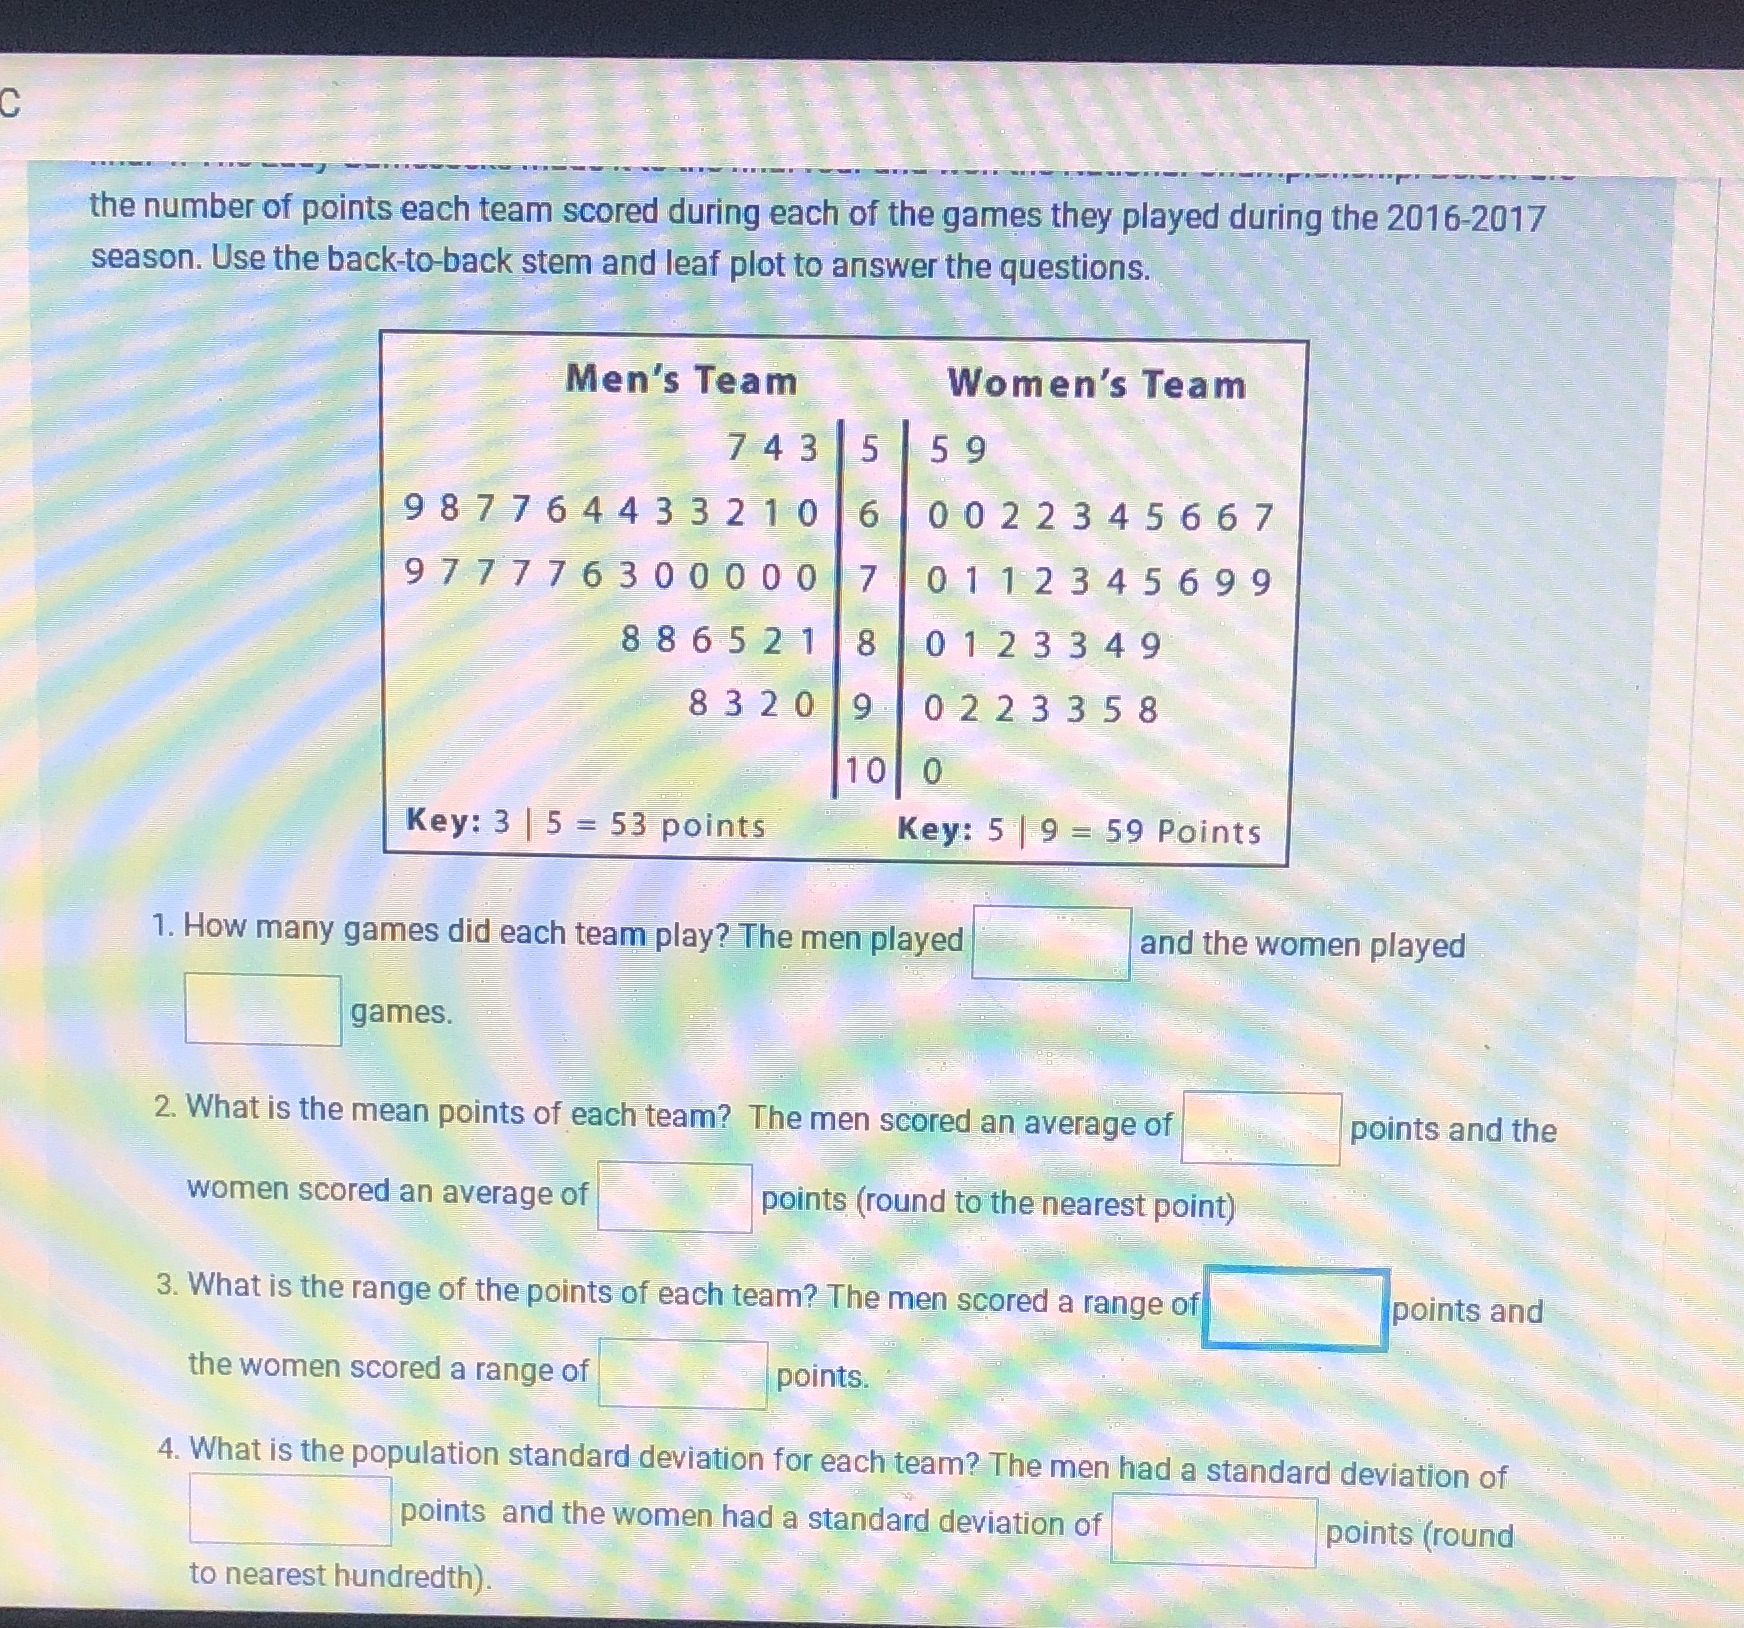
the number of points each team scored during each of the games they played during the 2016-2017 season. Use the back-to-back stem and leaf plot
Step by Step Solution
There are 3 Steps involved in it
Step: 1

Get Instant Access to Expert-Tailored Solutions
See step-by-step solutions with expert insights and AI powered tools for academic success
Step: 2

Step: 3
Ace Your Homework with AI
Get the answers you need in no time with our AI-driven, step-by-step assistance
Get Started
Trigonometry
Authors: David M Kennedy, James Stewart, Lothar Redlin, Saleem Watson
2nd Edition
1285226089, 9781285226088