The numbers and calculations are different numbers and it is based off 1,800 square foot house not 1200 as in what was previously mention and
The numbers and calculations are different numbers and it is based off 1,800 square foot house not 1200 as in what was previously mention and shown.
Overview
Recall that samples are used to generate a statistic, which businesses use to estimate the population parameter. You have learned how to take samples from populations and use them to produce statistics. For two quantitative variables, businesses can use scatterplots and the correlation coefficient to explore a potential linear relationship. Furthermore, they can quantify the relationship in a regression equation.
Prompt
This assignment picks up where the Module Two assignment left off and will use components of that assignment as a foundation.
You have submitted your initial analysis to the sales team at D.M. Pan Real Estate Company. You will continue your analysis of the provided Real Estate Data spreadsheet using your selected region to complete your analysis. You may refer back to the initial report you developed in the Module Two Assignment Template to continue the work. This document and the National Summary Statistics and Graphs Real Estate Data spreadsheet will support your work on the assignment.
Note: In the report you prepare for the sales team, the dependent, or response, variable (y) should be the listing price and the independent, or predictor, variable (x) should be the square feet.
Using the Module Three Assignment Template, specifically address the following:
Regression Equation: Provide the regression equation for the line of best fit using the scatterplot from the Module Two assignment.
Determine r: Determine r and what it means. (What is the relationship between the variables?)
Determine the strength of the correlation (weak, moderate, or strong).
Discuss how you determine the direction of the association between the two variables.
Is there a positive or negative association?
What do you see as the direction of the correlation?
Examine the Slope and Intercepts: examine th eslope b1 and and interslope b0
Draw conclusions from the slope and intercept in the context of this problem.
Does the intercept make sense based on your observation of the line of best fit?
Determine the value of the land only. Note: You can assume, when the square footage of the house is zero, that the price is the value of just the land. This happens when x=0, which is the y-intercept. Does this value make sense in context?
Determine the R-squared Coefficient: Determine the R-squared value.
Discuss what R-squared means in the context of this analysis.
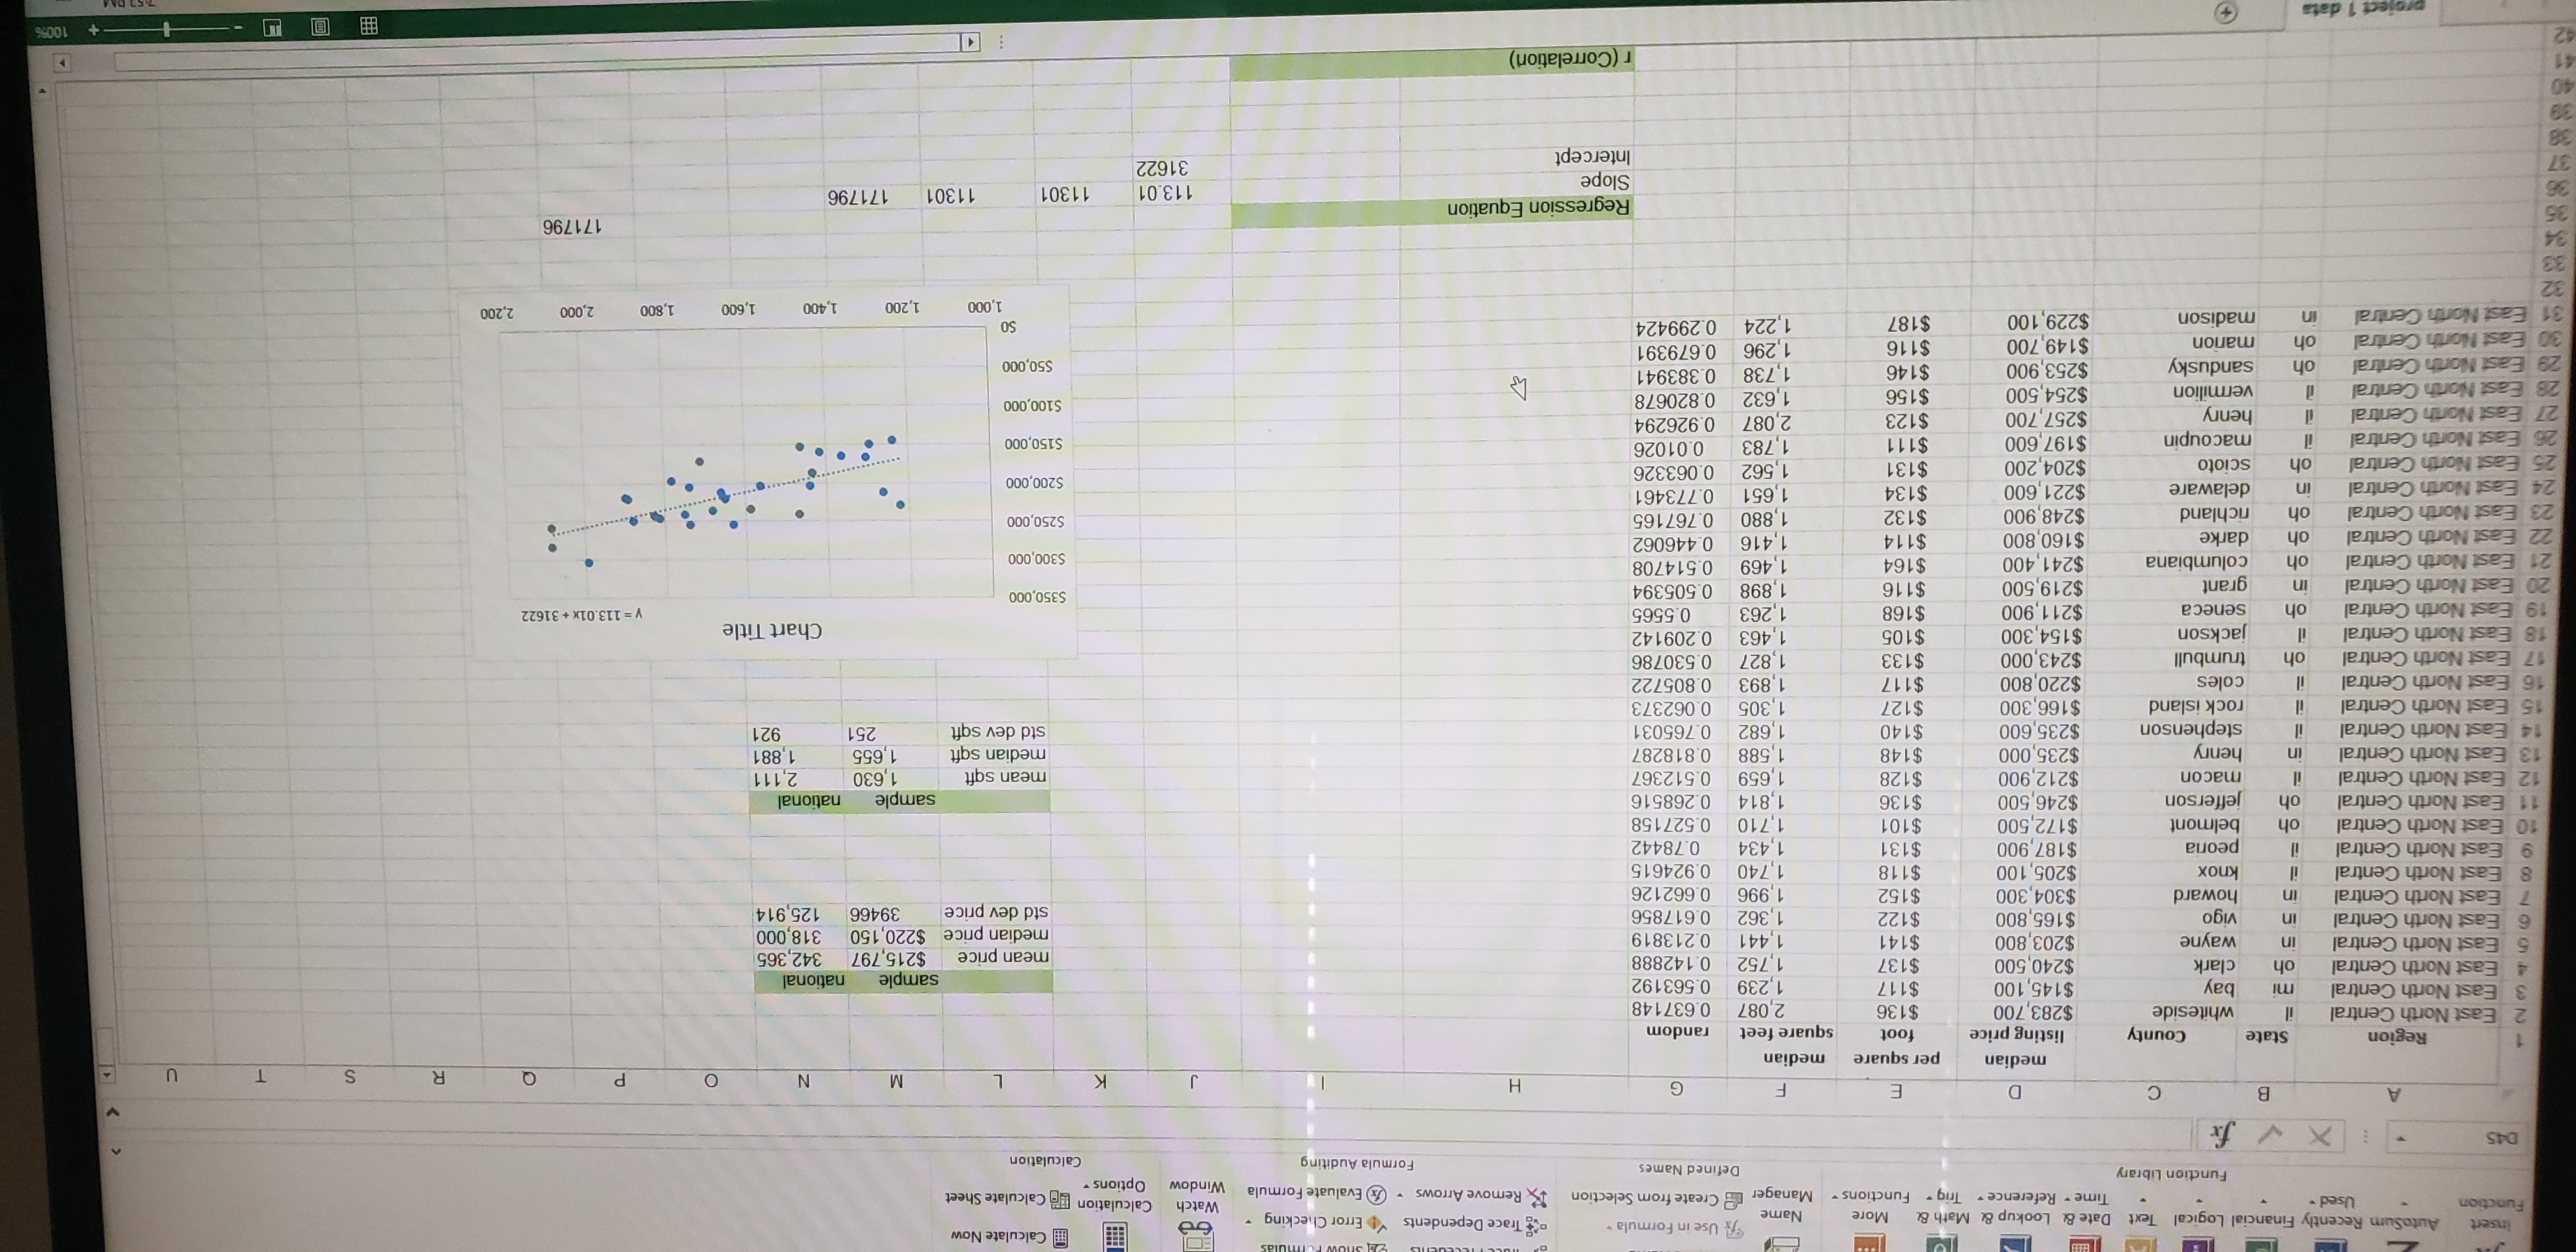
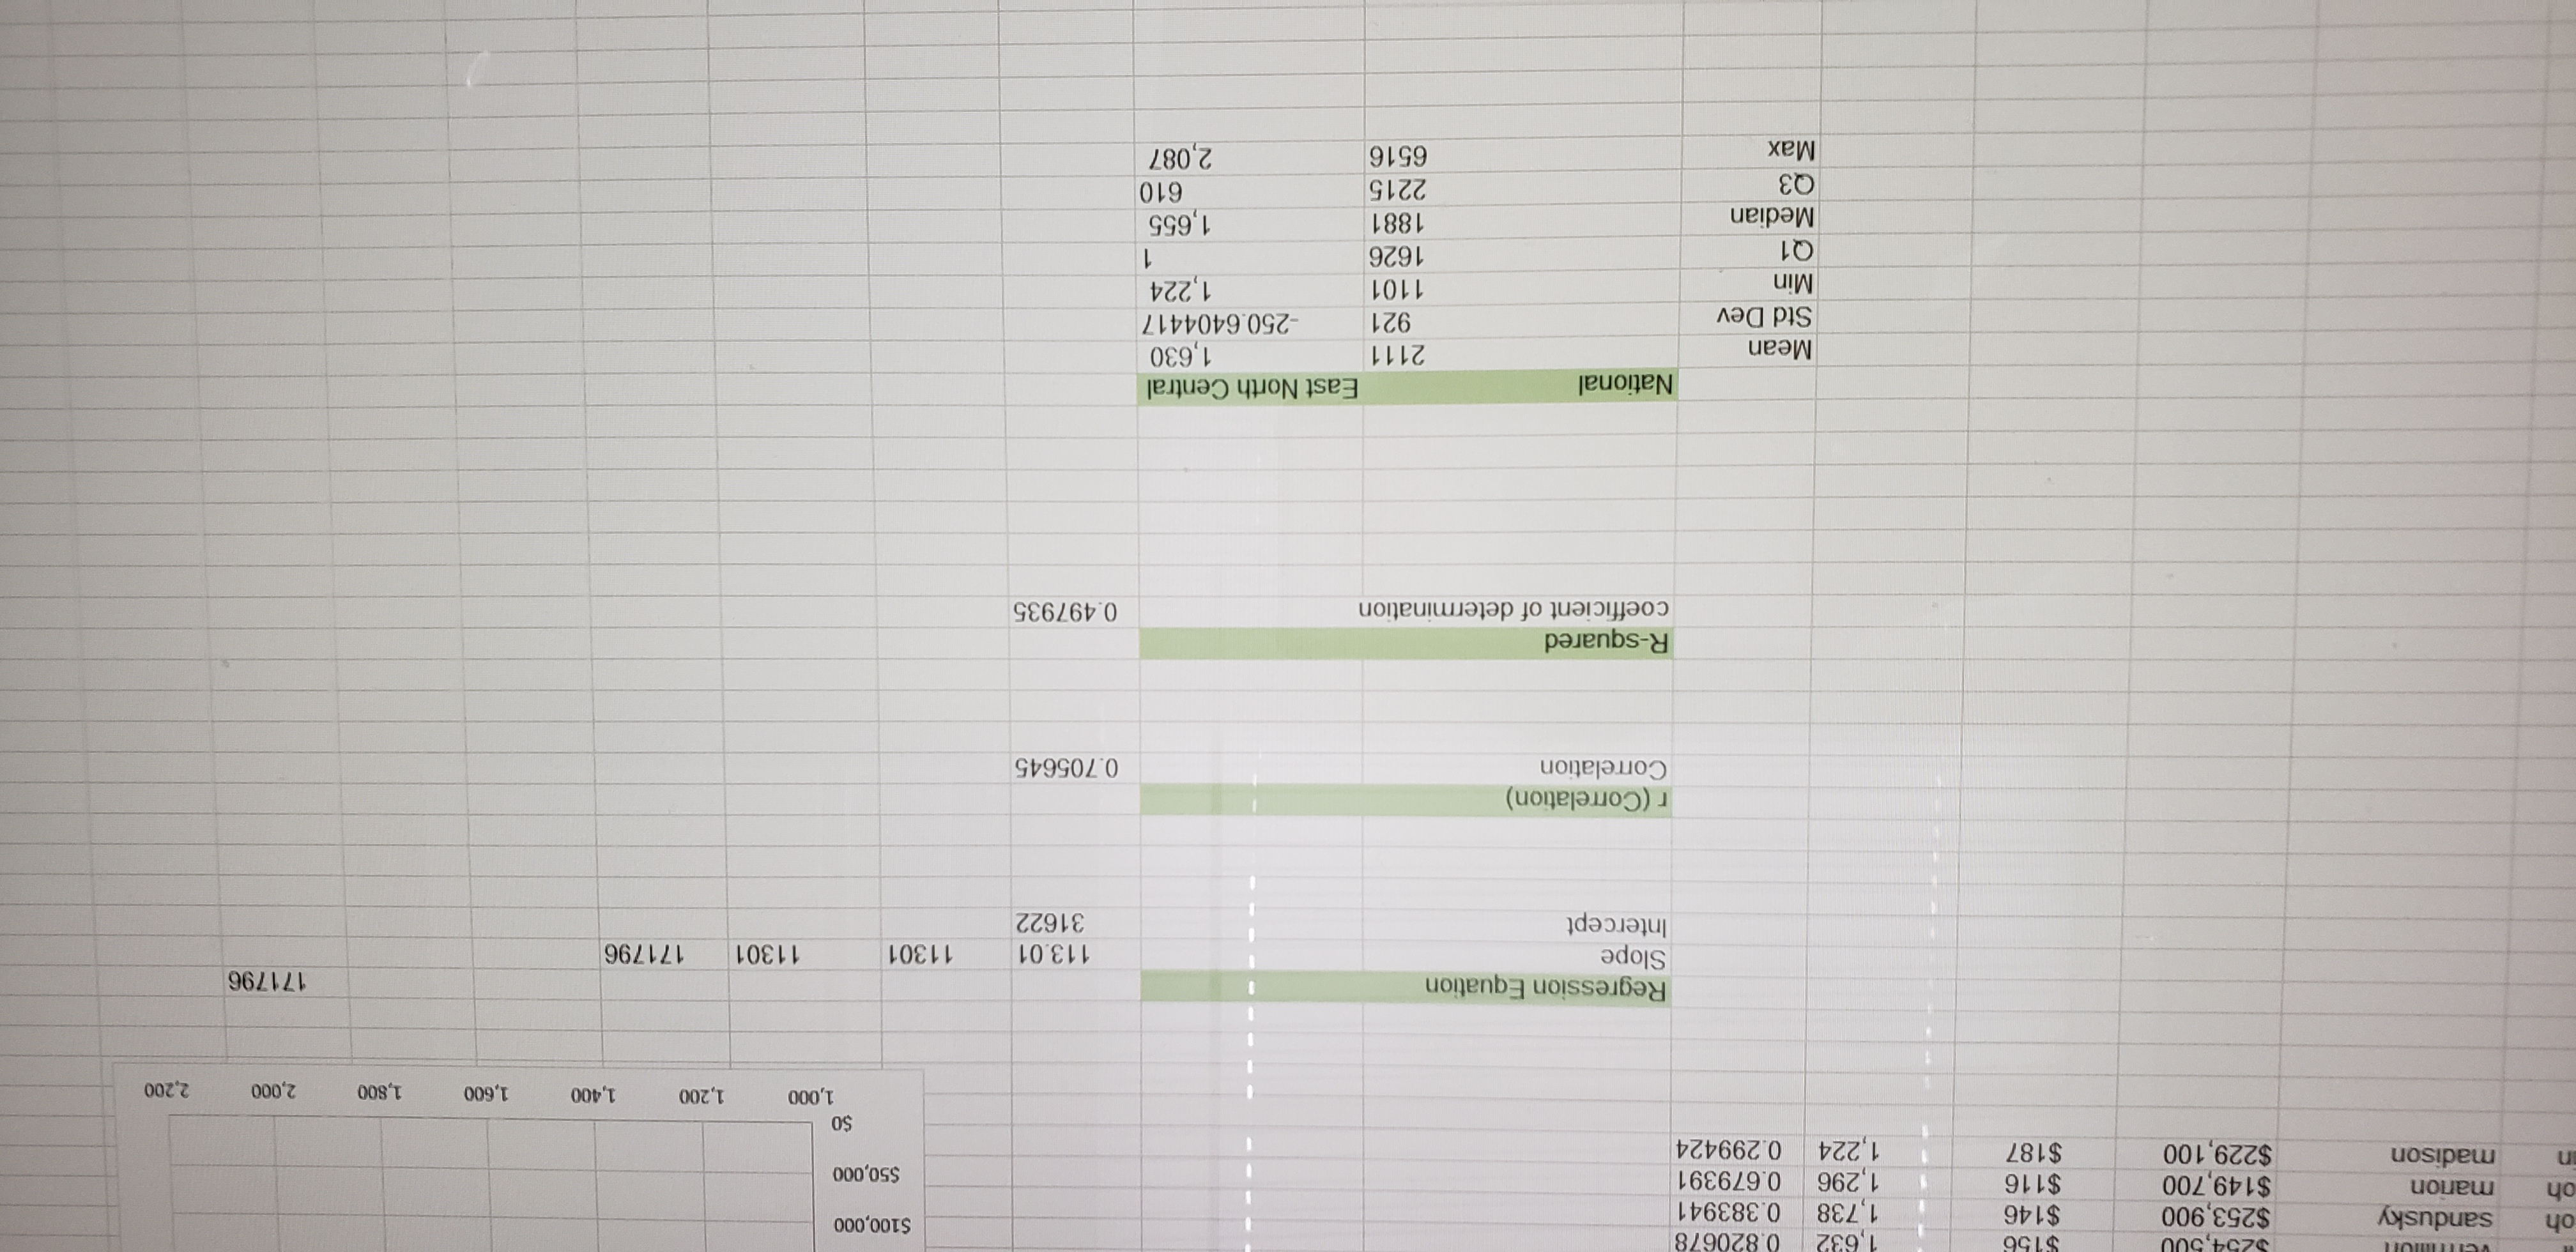
MAT 240 Module Three Assignment Template - Word INSERT DESIGN PAGE LAYOUT REFERENCES MAILINGS REVIEW VIEW Median Housing Price Prediction Model for D.M. Pan National Real Estate Company 2 Module Two Notes [Copy and paste any relevant information from your Module Two assignment here to assist you in completing this assignment. This section is not graded and is only provided to help you easily review Module Two assignment information while completing this assignment.] Regression Equation [Insert the regression equation for the line of best fit using the scatterplot from your Module Two assignment.] Determine r [Determine r and what it means, including determining the strength of the correlation and discussing how you determine the direction of the association between the two variables.] Examine the Slope and Intercepts [Draw conclusions from the slope and intercept in the context of this problem and determine the value of only the land.] R-squared Coefficient [Explain what R-squared means in the context of this analysis.] Conclusions [Reflect on the relationship between square feet and sales price by addressing key considerations such as the comparison between your selected region and overall homes in the United States, as well as analyzing how the slope can help identify price changes, how the regression equation can help identify appropriate listing prices, and what square footage ranges the graph would be best used for.] Ges e W T WEInsert Calculate Now AutoSum Recently Financial Logical Text Date & Lookup & Math & More Name fx Use in Formula Trace Dependents Error Checking Function Used . Time . Reference . Trig . Functions . Manager [ Create from Selection Watch X Remove Arrows * x Evaluate Formula Window Calculation [ Calculate Sheet Options Function Library Defined Names Formula Auditing Calculation D45 B C D E G H K M N O P Q R S T U median per square median Region State County listing price foot square feet random 2 East North Central il whiteside $283,700 $136 2,087 0.637148 3 East North Central mi bay $145, 100 $117 1,239 0.563192 4 East North Central sample national oh clark $240,500 $137 1,752 0. 142888 5 East North Central mean price $215,797 342,365 in wayne $203,800 $141 1,441 0.213819 median price $220, 150 318,000 6 East North Central in vigo $165,800 $122 1,362 0.617856 std dev price 39466 125,914 7 East North Central in howard $304,300 $152 1,996 0.662126 East North Central knox $205, 100 $118 1,740 0.924615 9 East North Central peoria $187,900 $13 1,434 0.78442 10 East North Central oh belmont $172,500 $101 1,710 0.527158 11 East North Central oh jefferson $246,500 $136 814 0.268516 sample national 12 East North Central il macon $212,900 $128 1,659 0.512367 mean sqft 1,630 2, 111 13 East North Central in henry $235,000 $148 1,588 0.818287 median sqft 1,655 1,881 14 East North Central stephenson $235,600 $140 ,682 0.765031 std dev sqft 251 921 15 East North Central rock island $166,300 $127 1,305 0.062373 16 East North Central coles $220,800 $117 1,893 0.805722 17 East North Central oh trumbull $243,000 $133 1,827 0.530786 18 East North Central jackson $154,300 $105 1,463 0.209142 Chart Title East North Central oh seneca $211,900 $168 1,263 0.5565 y = 113.01x + 31622 ast North Central in grant $219,500 $116 1,898 0.505394 $350,000 East North Central oh columbiana $241,400 $164 1,469 0.514708 $300,000 ast North Central oh darke $160,800 $114 1,416 0.446062 North Central oh richland $248,900 $132 1,880 0.767165 $250,000 ast North Central in delaware $221,600 $134 1,651 0.773461 North Central oh scioto $204,200 $131 1,562 0.063326 $200,000 ast North Central il macoupin $197,600 $111 1,783 0.01026 $150,000 East North Central henry $257,700 $123 2,087 0.926294 $254,500 $156 1,632 0.820678 $100,000 East North Central it vermilion 29 East North Central sandusky $253,900 $146 1,738 0.383941 $50,000 30 East North Central oh manon $149,700 $116 1,296 0.679391 31 East North Central in madison $229, 100 $187 0.299424 SO 1,000 1,200 1,400 1,600 1,800 2,000 2,200 32 33 171796 Regression Equation 113.01 11301 11301 171796 Slope Intercept 31622 r (Correlation) 100%254,5 $156 1,632 0.820678 oh sandusky $253,900 $146 1,738 0.383941 $100,000 oh marion $149,700 $116 1,296 0.679391 $50,000 madison $229, 100 $187 1,224 0.299424 50 1,000 1,200 1,400 1,600 1,800 2,000 2,200 Regression Equation 171796 Slope 113.01 11301 11301 171796 Intercept 31622 r (Correlation) Correlation 0.705645 R-squared coefficient of determination 0.497935 National East North Central Mean 2111 1,630 Std Dev 921 -250.6404417 Min 1101 1,224 Q1 1626 Median 1881 1,655 Q3 2215 610 Max 6516 2,087
Step by Step Solution
There are 3 Steps involved in it
Step: 1
Get Instant Access to Expert-Tailored Solutions
See step-by-step solutions with expert insights and AI powered tools for academic success
Step: 2
Step: 3
Ace Your Homework with AI
Get the answers you need in no time with our AI-driven, step-by-step assistance