Question
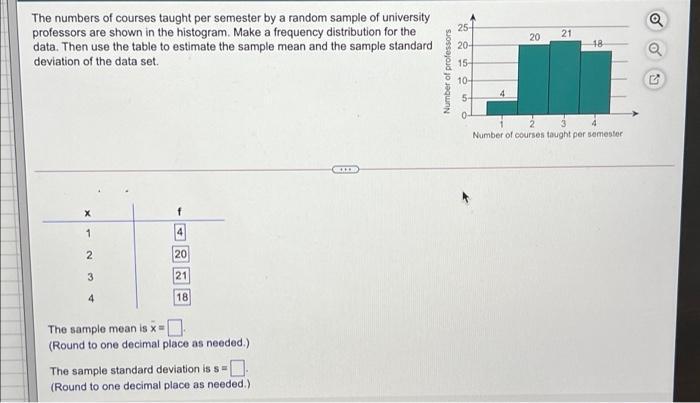
The numbers of courses taught per semester by a random sample of university professors are shown in the histogram. Make a frequency distribution for

The numbers of courses taught per semester by a random sample of university professors are shown in the histogram. Make a frequency distribution for the data. Then use the table to estimate the sample mean and the sample standard deviation of the data set. 25- 21 20 20- 48 15- 10- 5- Number of courses taught per semester 1. 2 20 3 21 4 18 The sample mean is x= (Round to one decimal place as needed.) The sample standard deviation is s=. (Round to one decimal place as needed.) Number of professors
Step by Step Solution
3.42 Rating (165 Votes )
There are 3 Steps involved in it
Step: 1
Mean 284 Standard deviation 091 X If xfx x xx f ...
Get Instant Access to Expert-Tailored Solutions
See step-by-step solutions with expert insights and AI powered tools for academic success
Step: 2

Step: 3

Ace Your Homework with AI
Get the answers you need in no time with our AI-driven, step-by-step assistance
Get StartedRecommended Textbook for
Elementary Statistics Picturing The World
Authors: Ron Larson, Betsy Farber
7th Edition
134683412, 978-0134683416
Students also viewed these Accounting questions
Question
Answered: 1 week ago
Question
Answered: 1 week ago
Question
Answered: 1 week ago
Question
Answered: 1 week ago
Question
Answered: 1 week ago
Question
Answered: 1 week ago
Question
Answered: 1 week ago
Question
Answered: 1 week ago
Question
Answered: 1 week ago
Question
Answered: 1 week ago
Question
Answered: 1 week ago
Question
Answered: 1 week ago
Question
Answered: 1 week ago
Question
Answered: 1 week ago
Question
Answered: 1 week ago
Question
Answered: 1 week ago
Question
Answered: 1 week ago
Question
Answered: 1 week ago
Question
Answered: 1 week ago
Question
Answered: 1 week ago
View Answer in SolutionInn App


