The NYS-Data File.sav is a dataset of 1450 records of individual high school students who answered a survey about their engagement in delinquent behavior. This data was collected in the 1990s and includes a few demographic questions and both qualitative and quantitative measures of delinquent attitudes and behavior.The questions that the students answered are listed as the variable labels.
Question 1: Is high school Grade Point Average ("GPA") associated with deviant or delinquent behavior?Use the variable gpa as the Independent variable and choose two of the following questions and their specific variables as potential dependent measures:
- How important is it to have friends? (Variable name is imp_frns)
- How important is it to you to go to college?(Variable name is imp_coll)
- How many of your friends have used marijuana or hashish? (Variable name is fr_usemj)
- How many of your friends have used alcohol? (Variable name is fr_useal)
State Hypotheses:Identify the level of measurement for each variable and state the Null and Alternative Hypotheses for the two bivariate comparisons that you chose.
Carry out tests of bivariate association using ChiSquare, paste in (or summarize) the results.
Report results of your two statistical tests using ChiSquare in APA.
______________________________________________________________________________
Question 2:Is the age of the student (the variable is age) associated with minor deviant behavior?Generate a correlation matrix for the following variables, paste it into this document:
- Age (is the Independent variable for this research question).
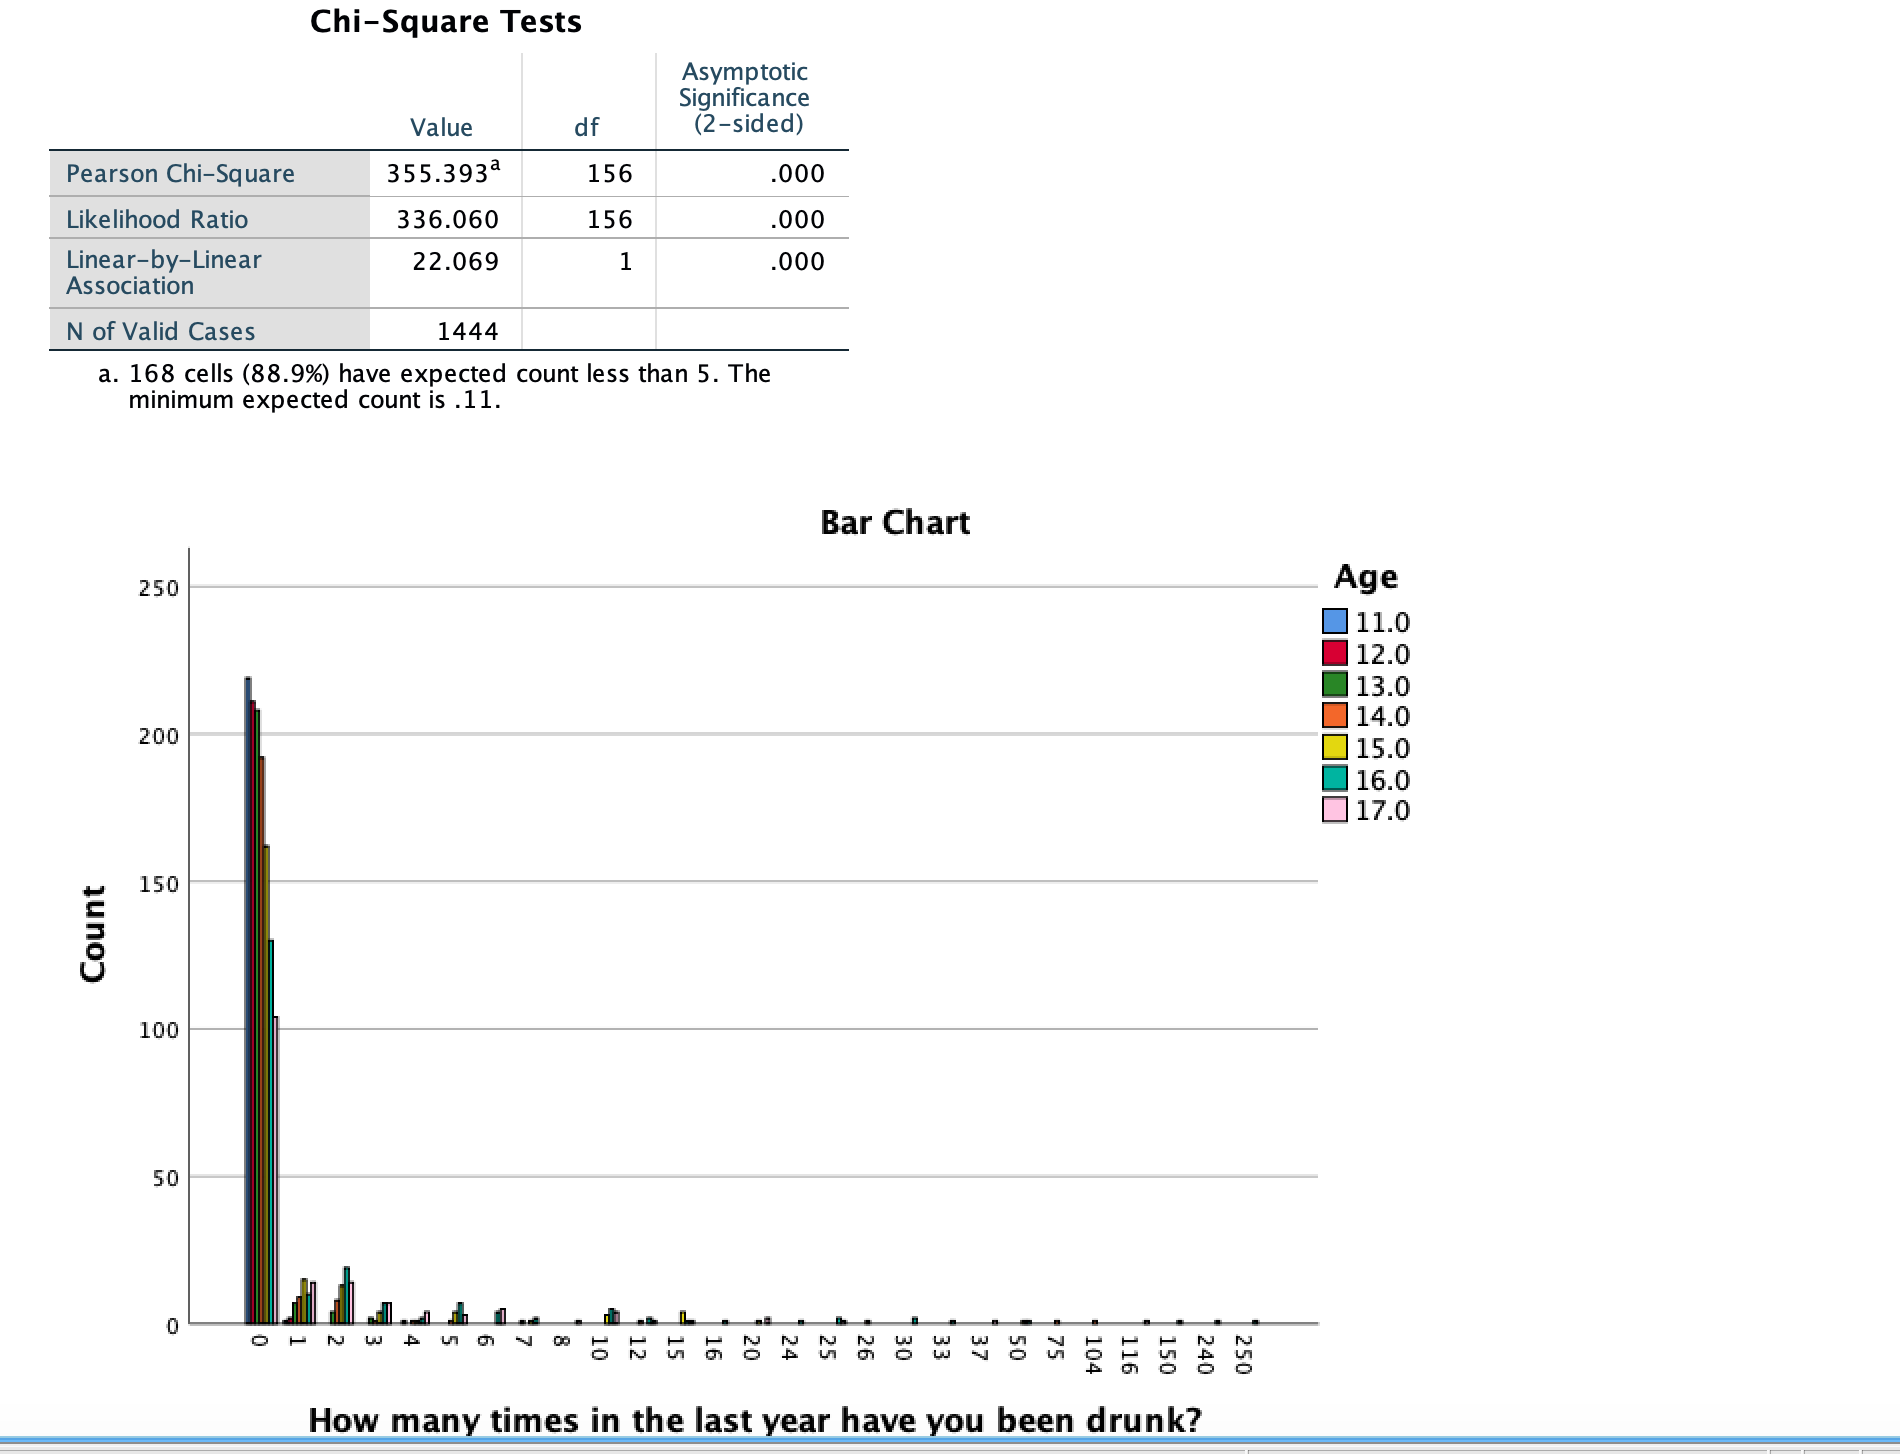
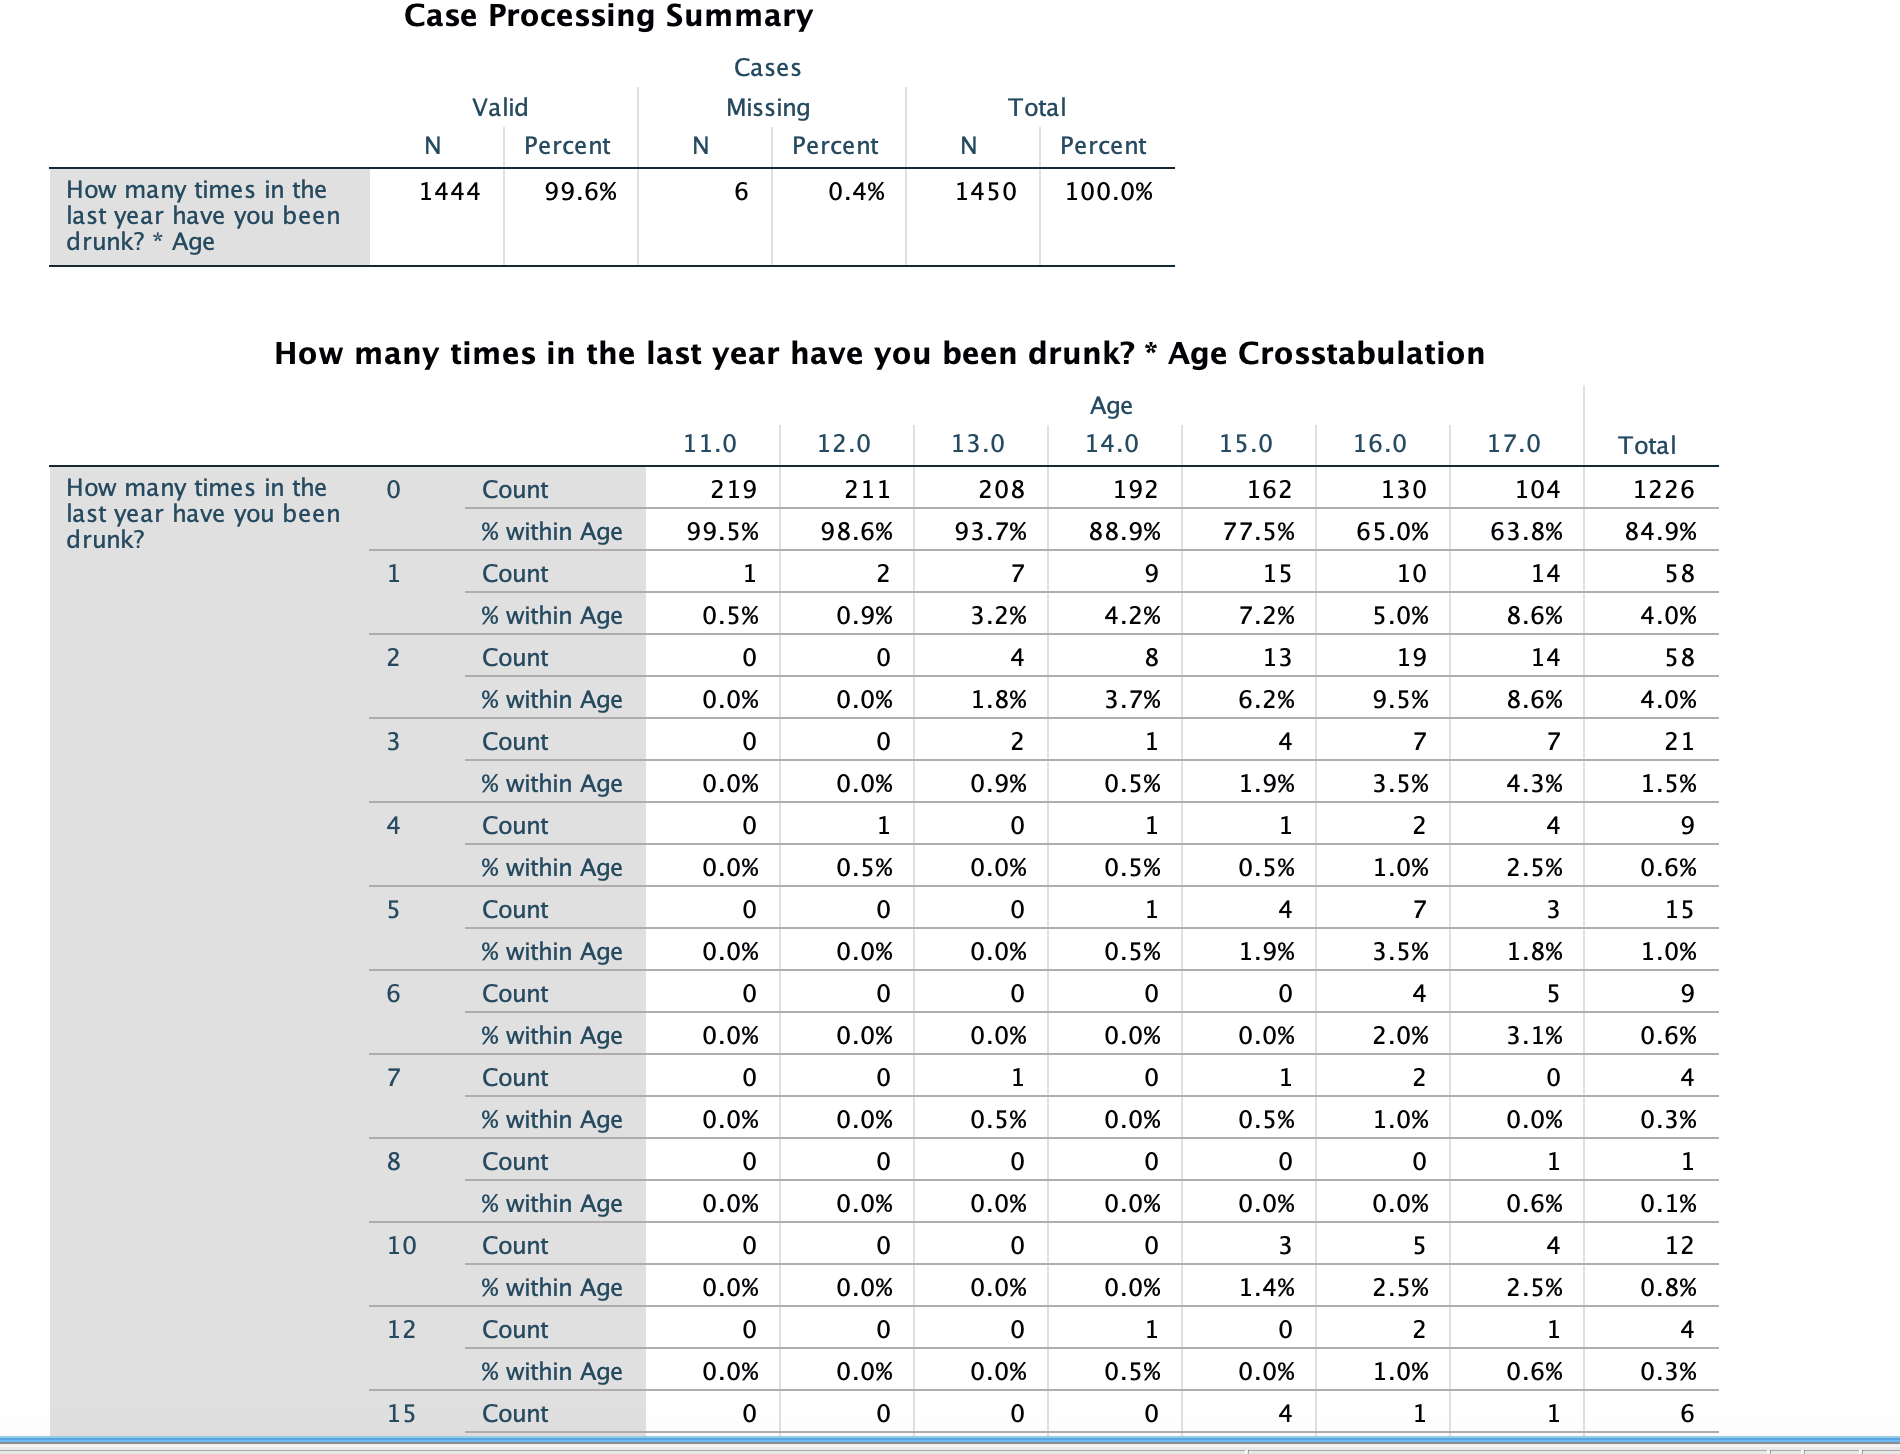
- How many times in the last year have you been drunk? (Variable is drunk - a DV)
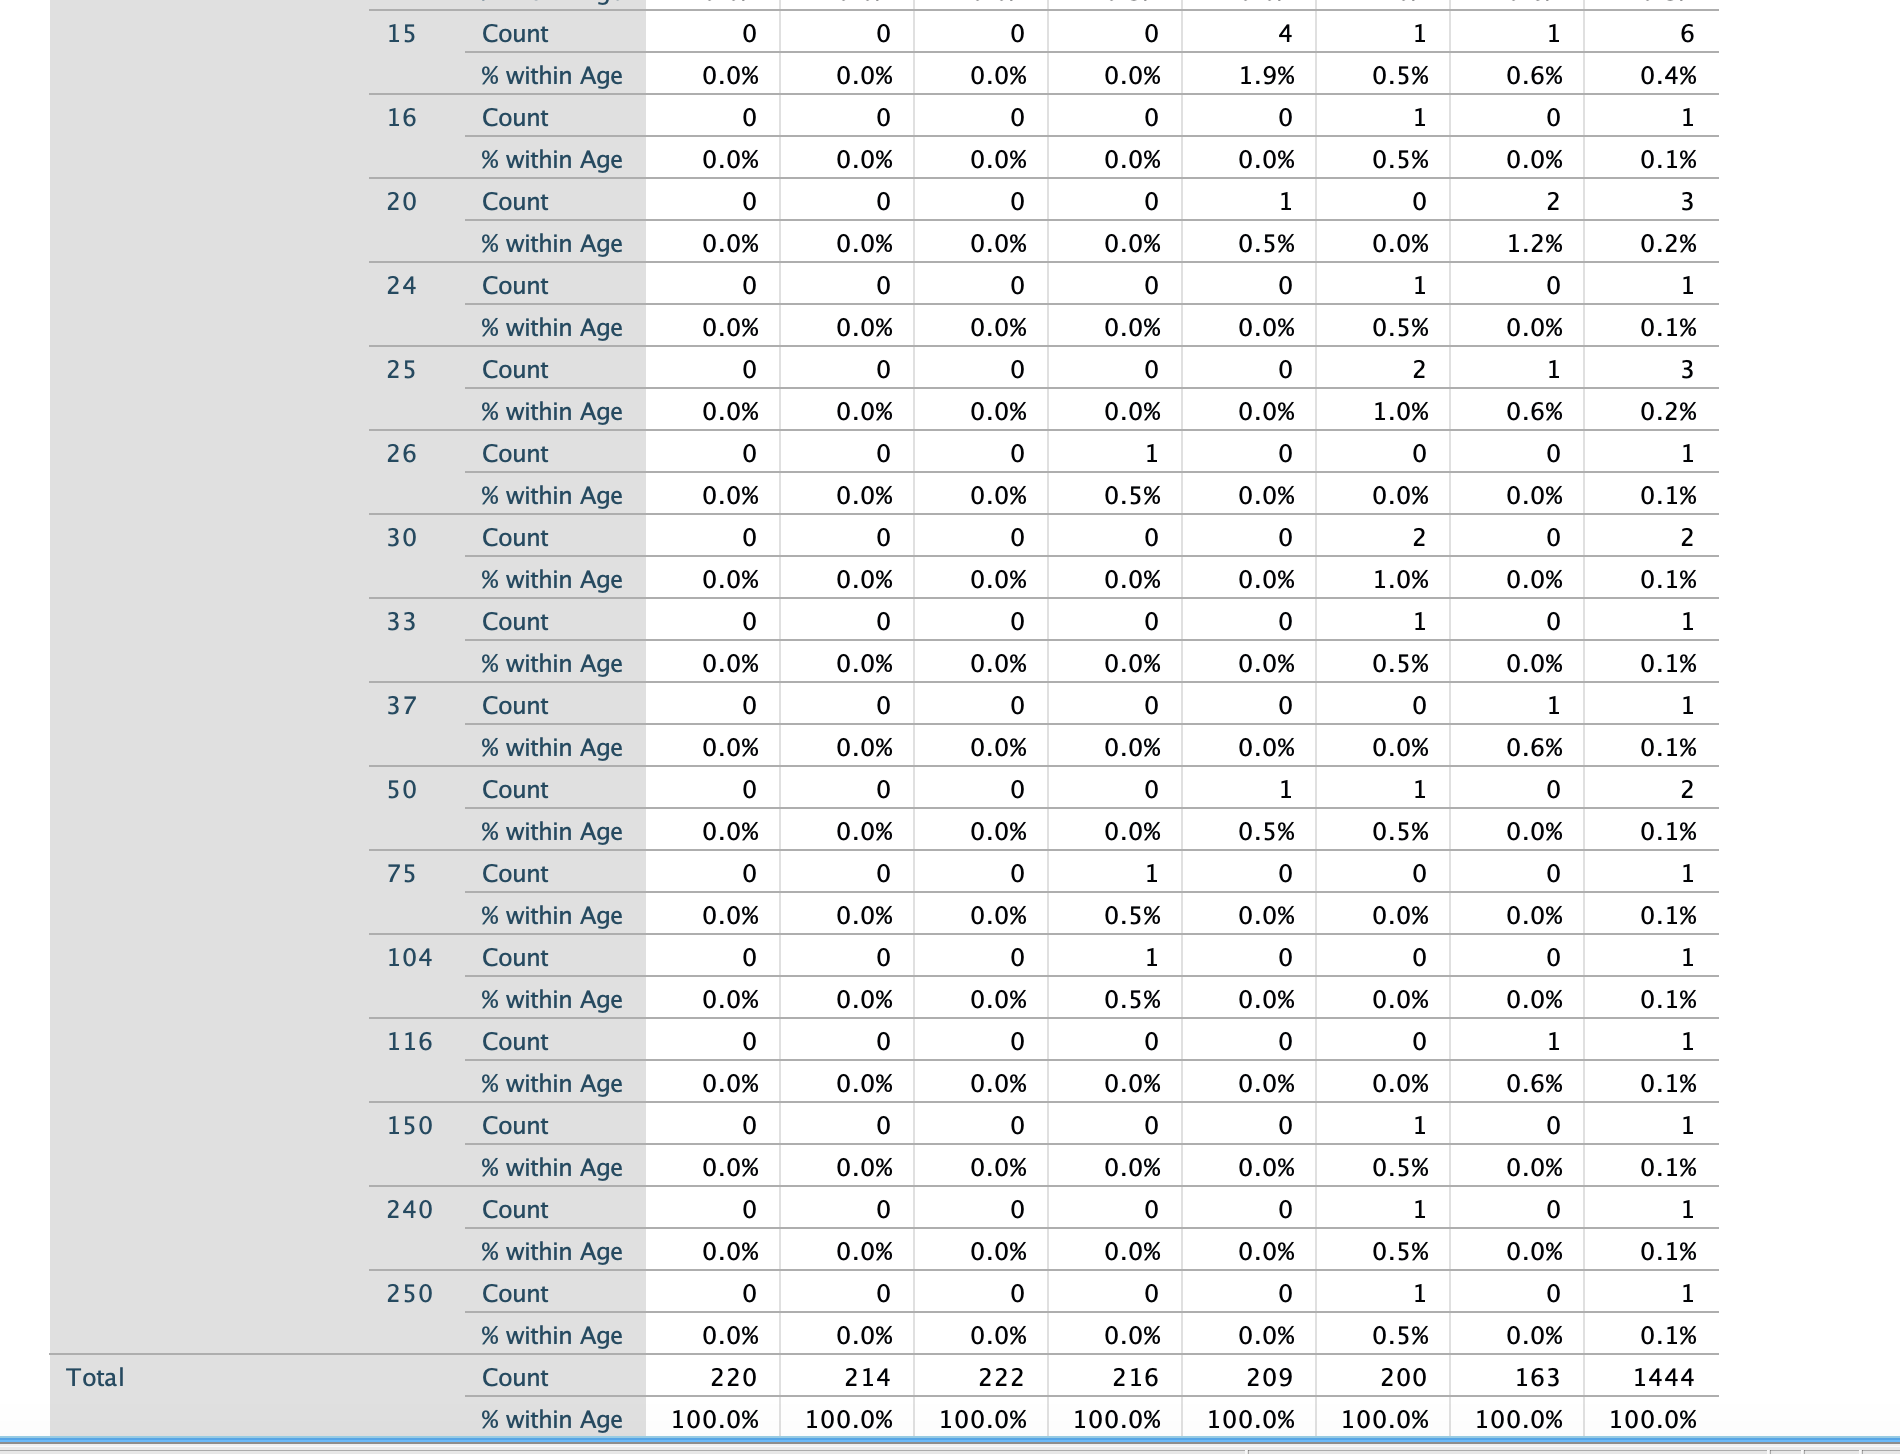
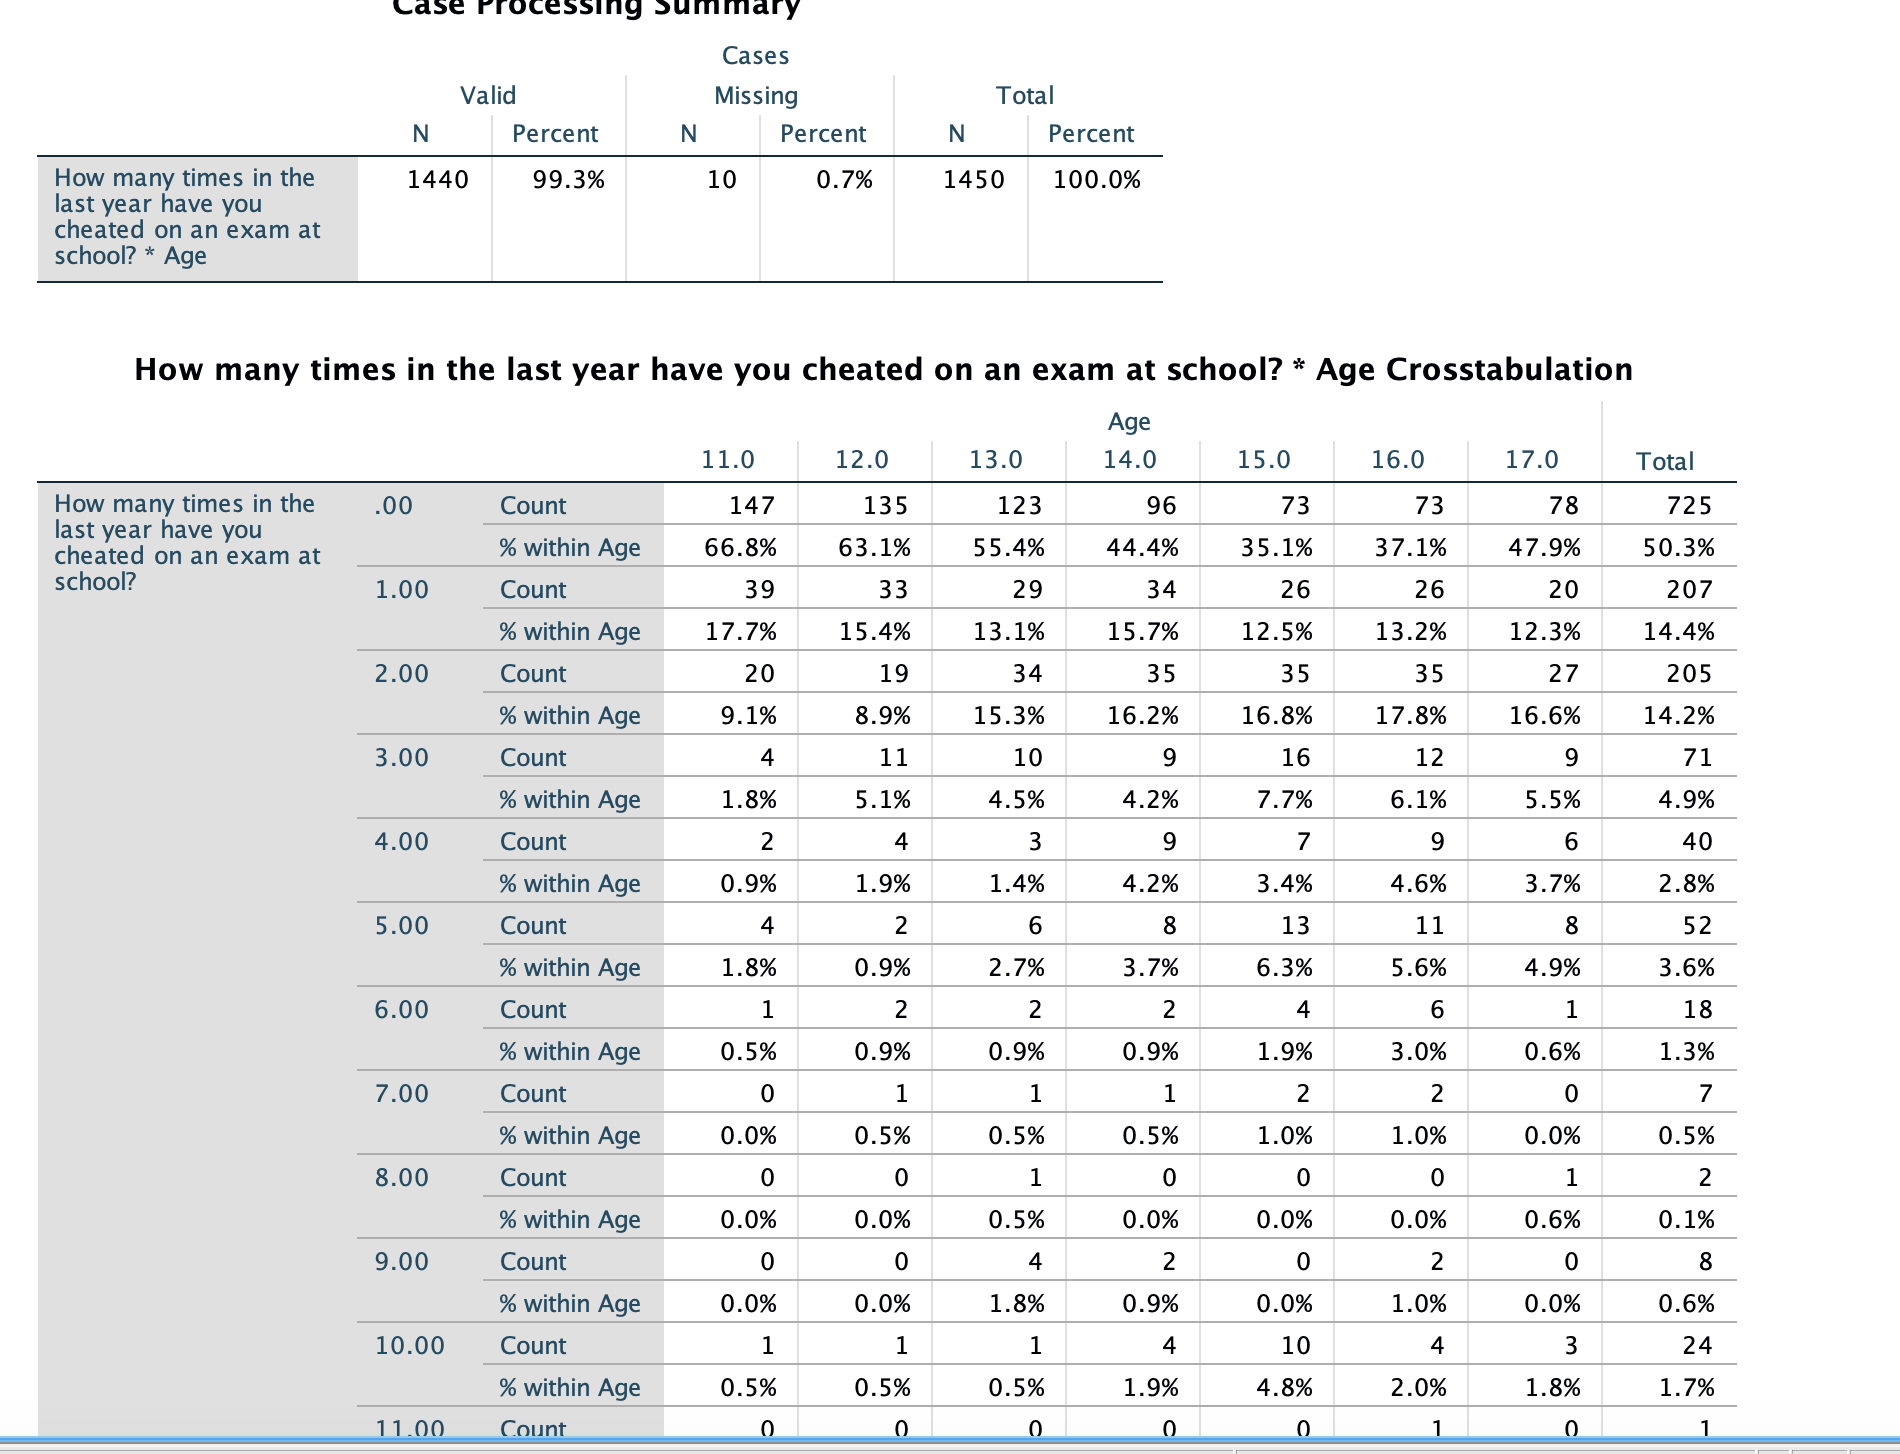
- How many times in the last year have you cheated on an exam at school? (Variable is cheat- a DV)
- How many times in the last year have you stolen something worth $5 or less (Variable is thftu5 - a DV)
State the Null and Alternative hypotheses for the IV and one of DVs.
Report all statistically significant bivariate associations in the table below - strength of the correlation, direction of the correlation and statistical significance.If the relationship is not statistically significant, leave the row blank or type in NS
Independent Variable Name
Pearson's r
Strength of the relationship
Direction of the relationship
Probability that the result is a chance association
AGE & DRUNK
AGE & CHEAT
AGE & THEFT -
Variable = thftu5
Summary of Results
Write paragraph that describes what you have understood about the factors that may play a role in juvenile delinquency, based only on the results of these two research questions.
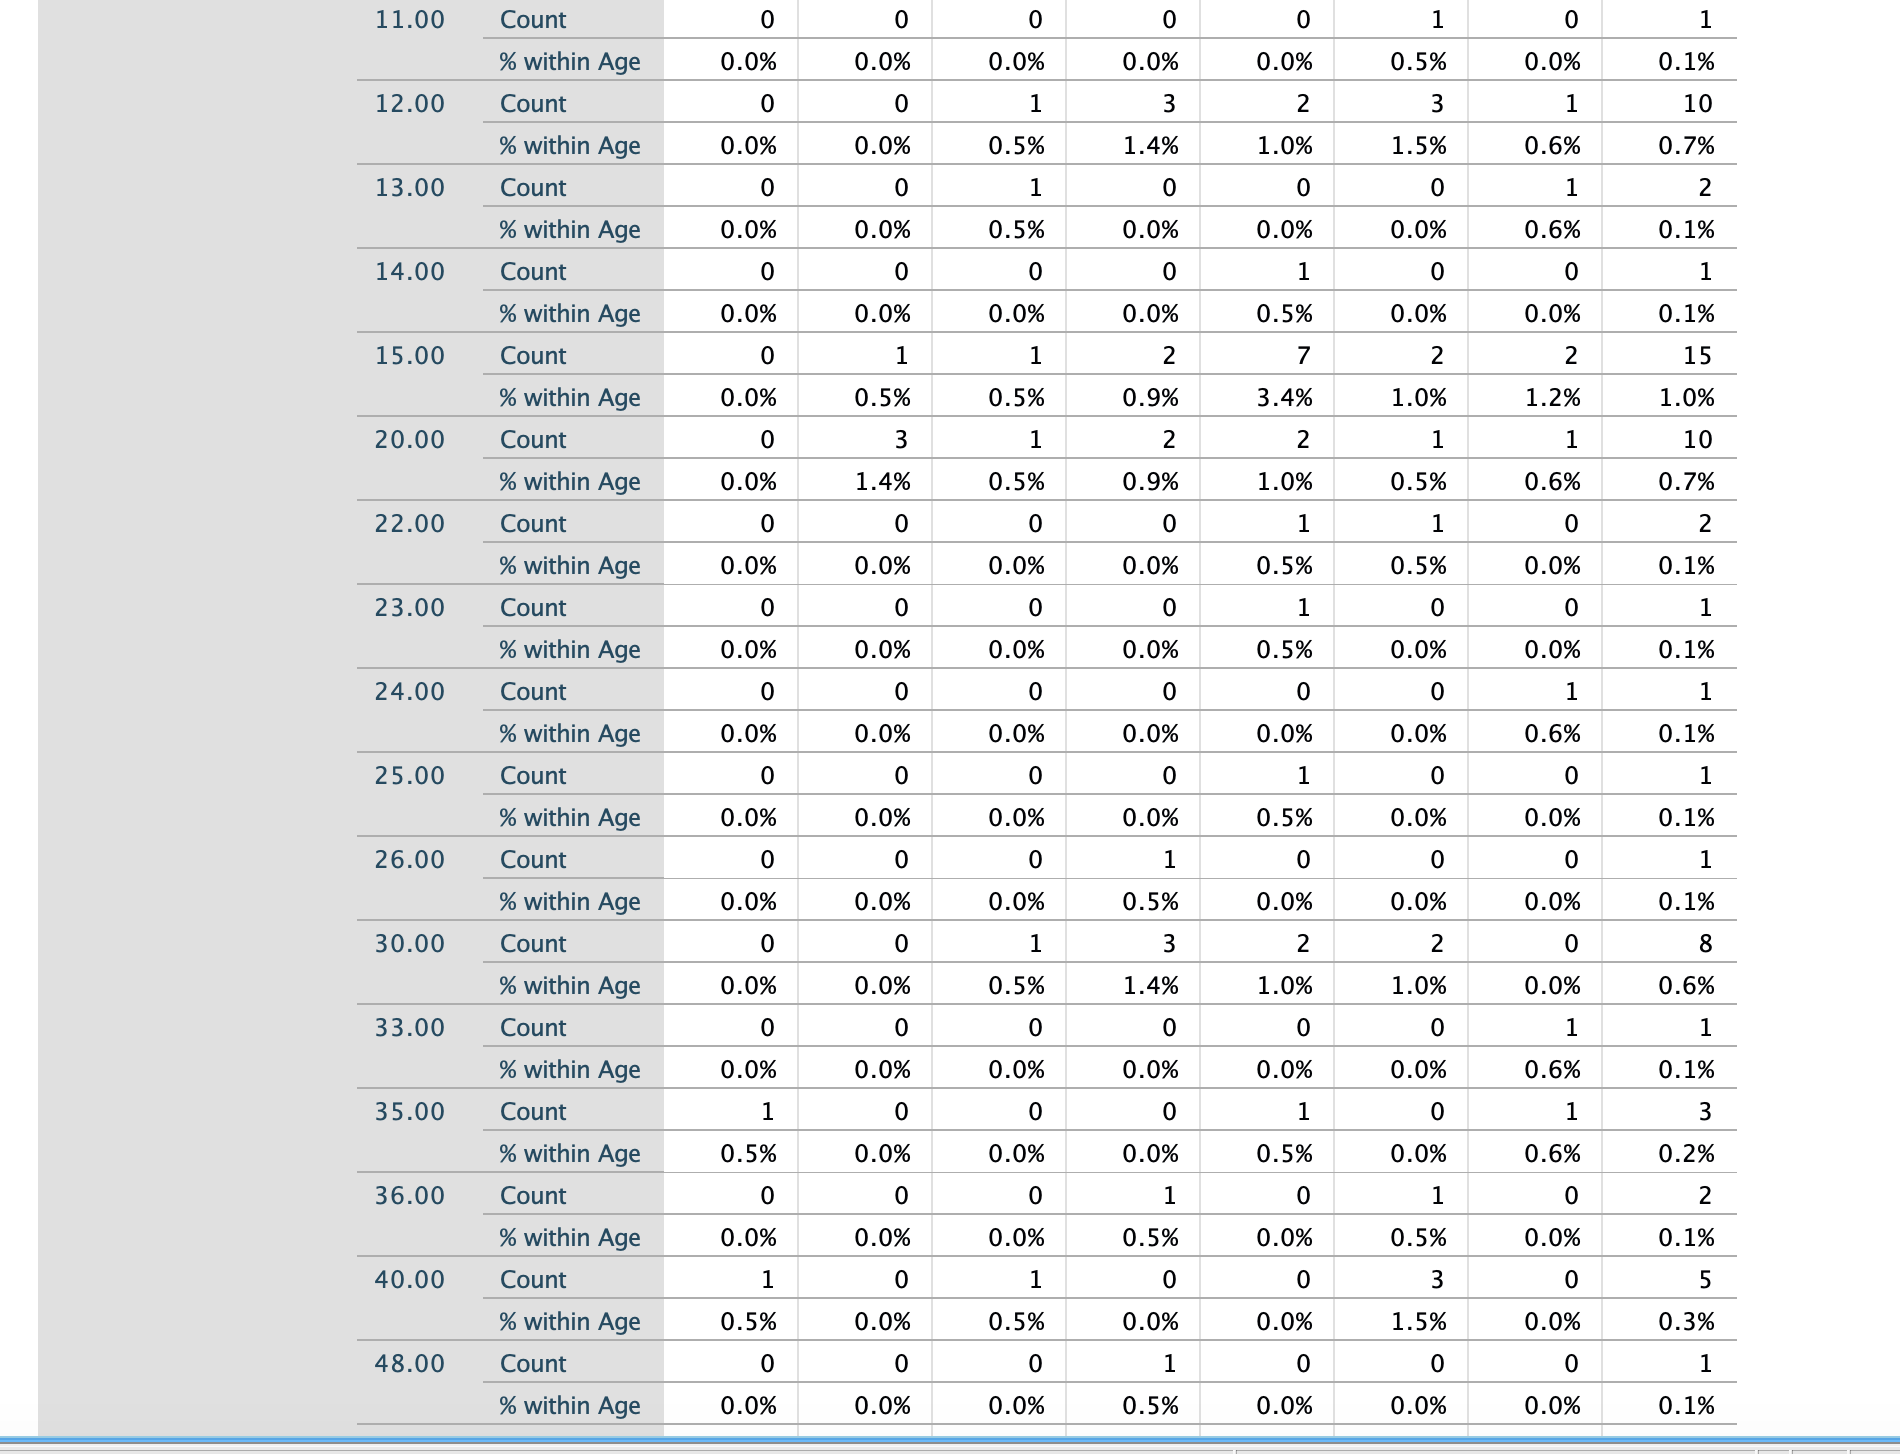
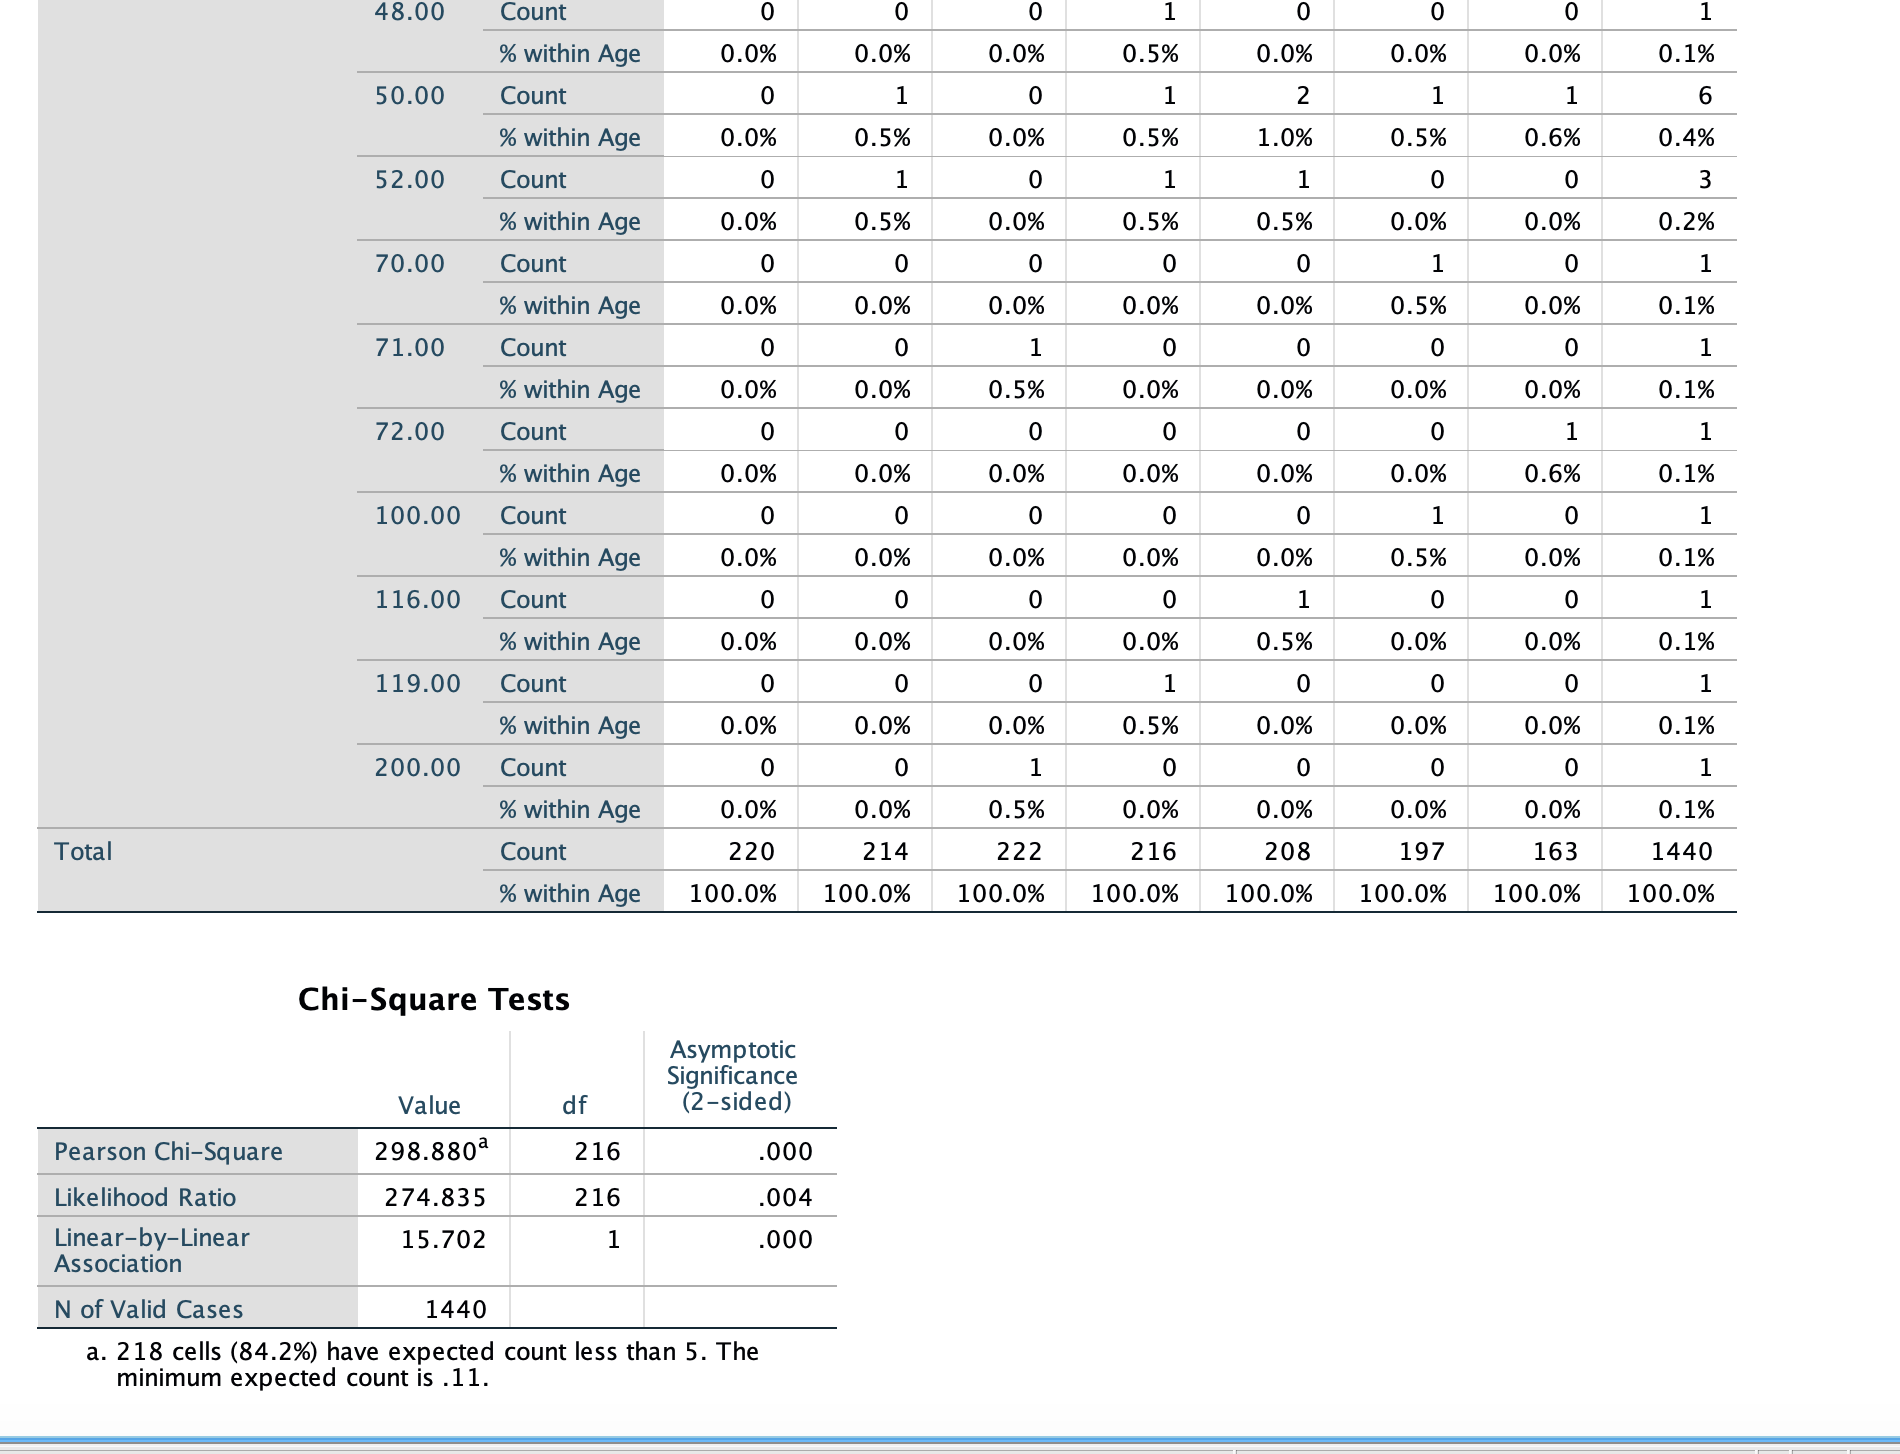
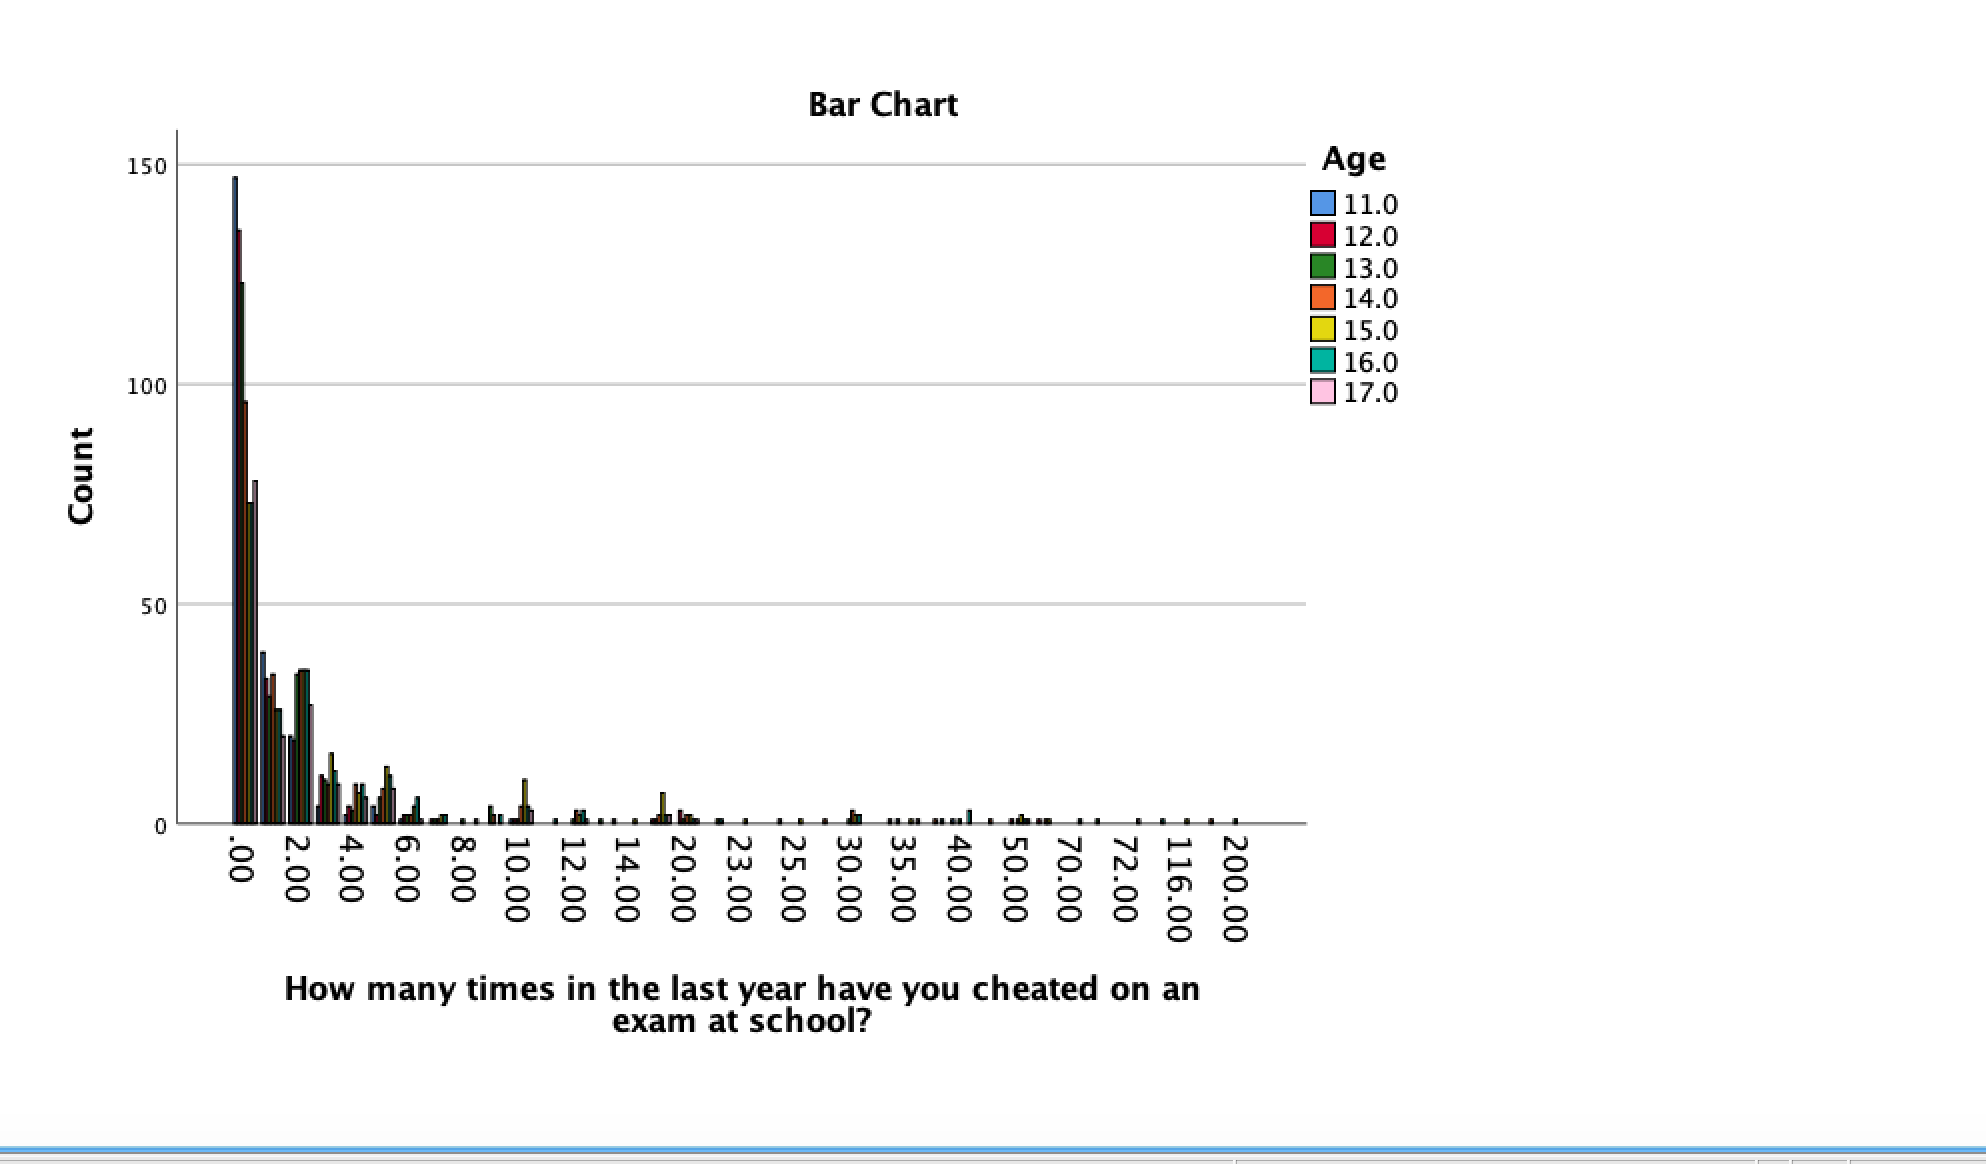
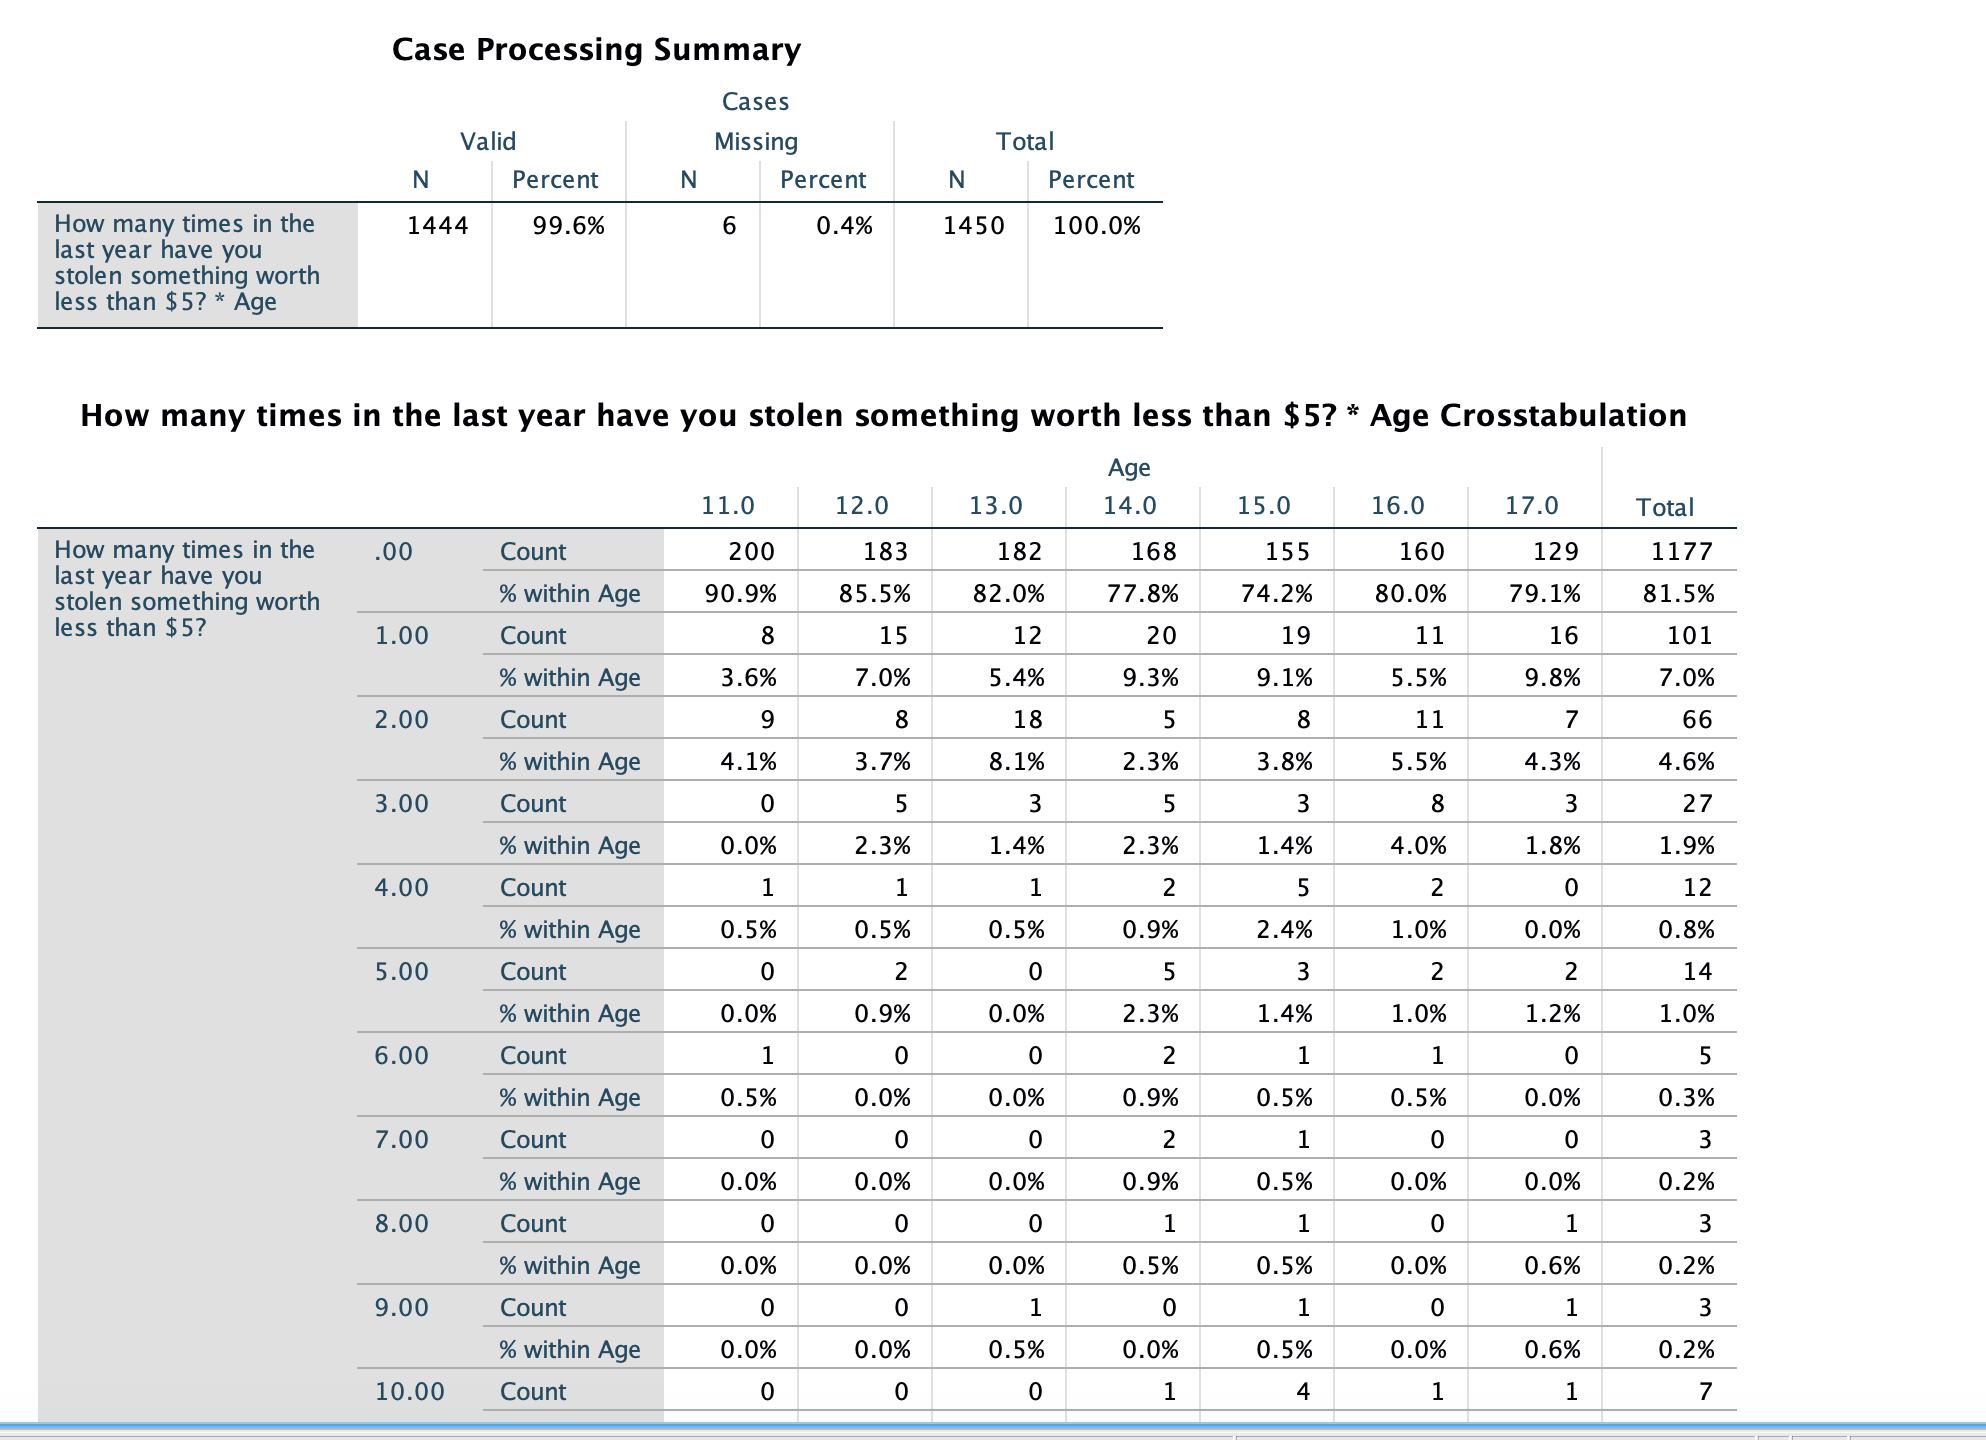
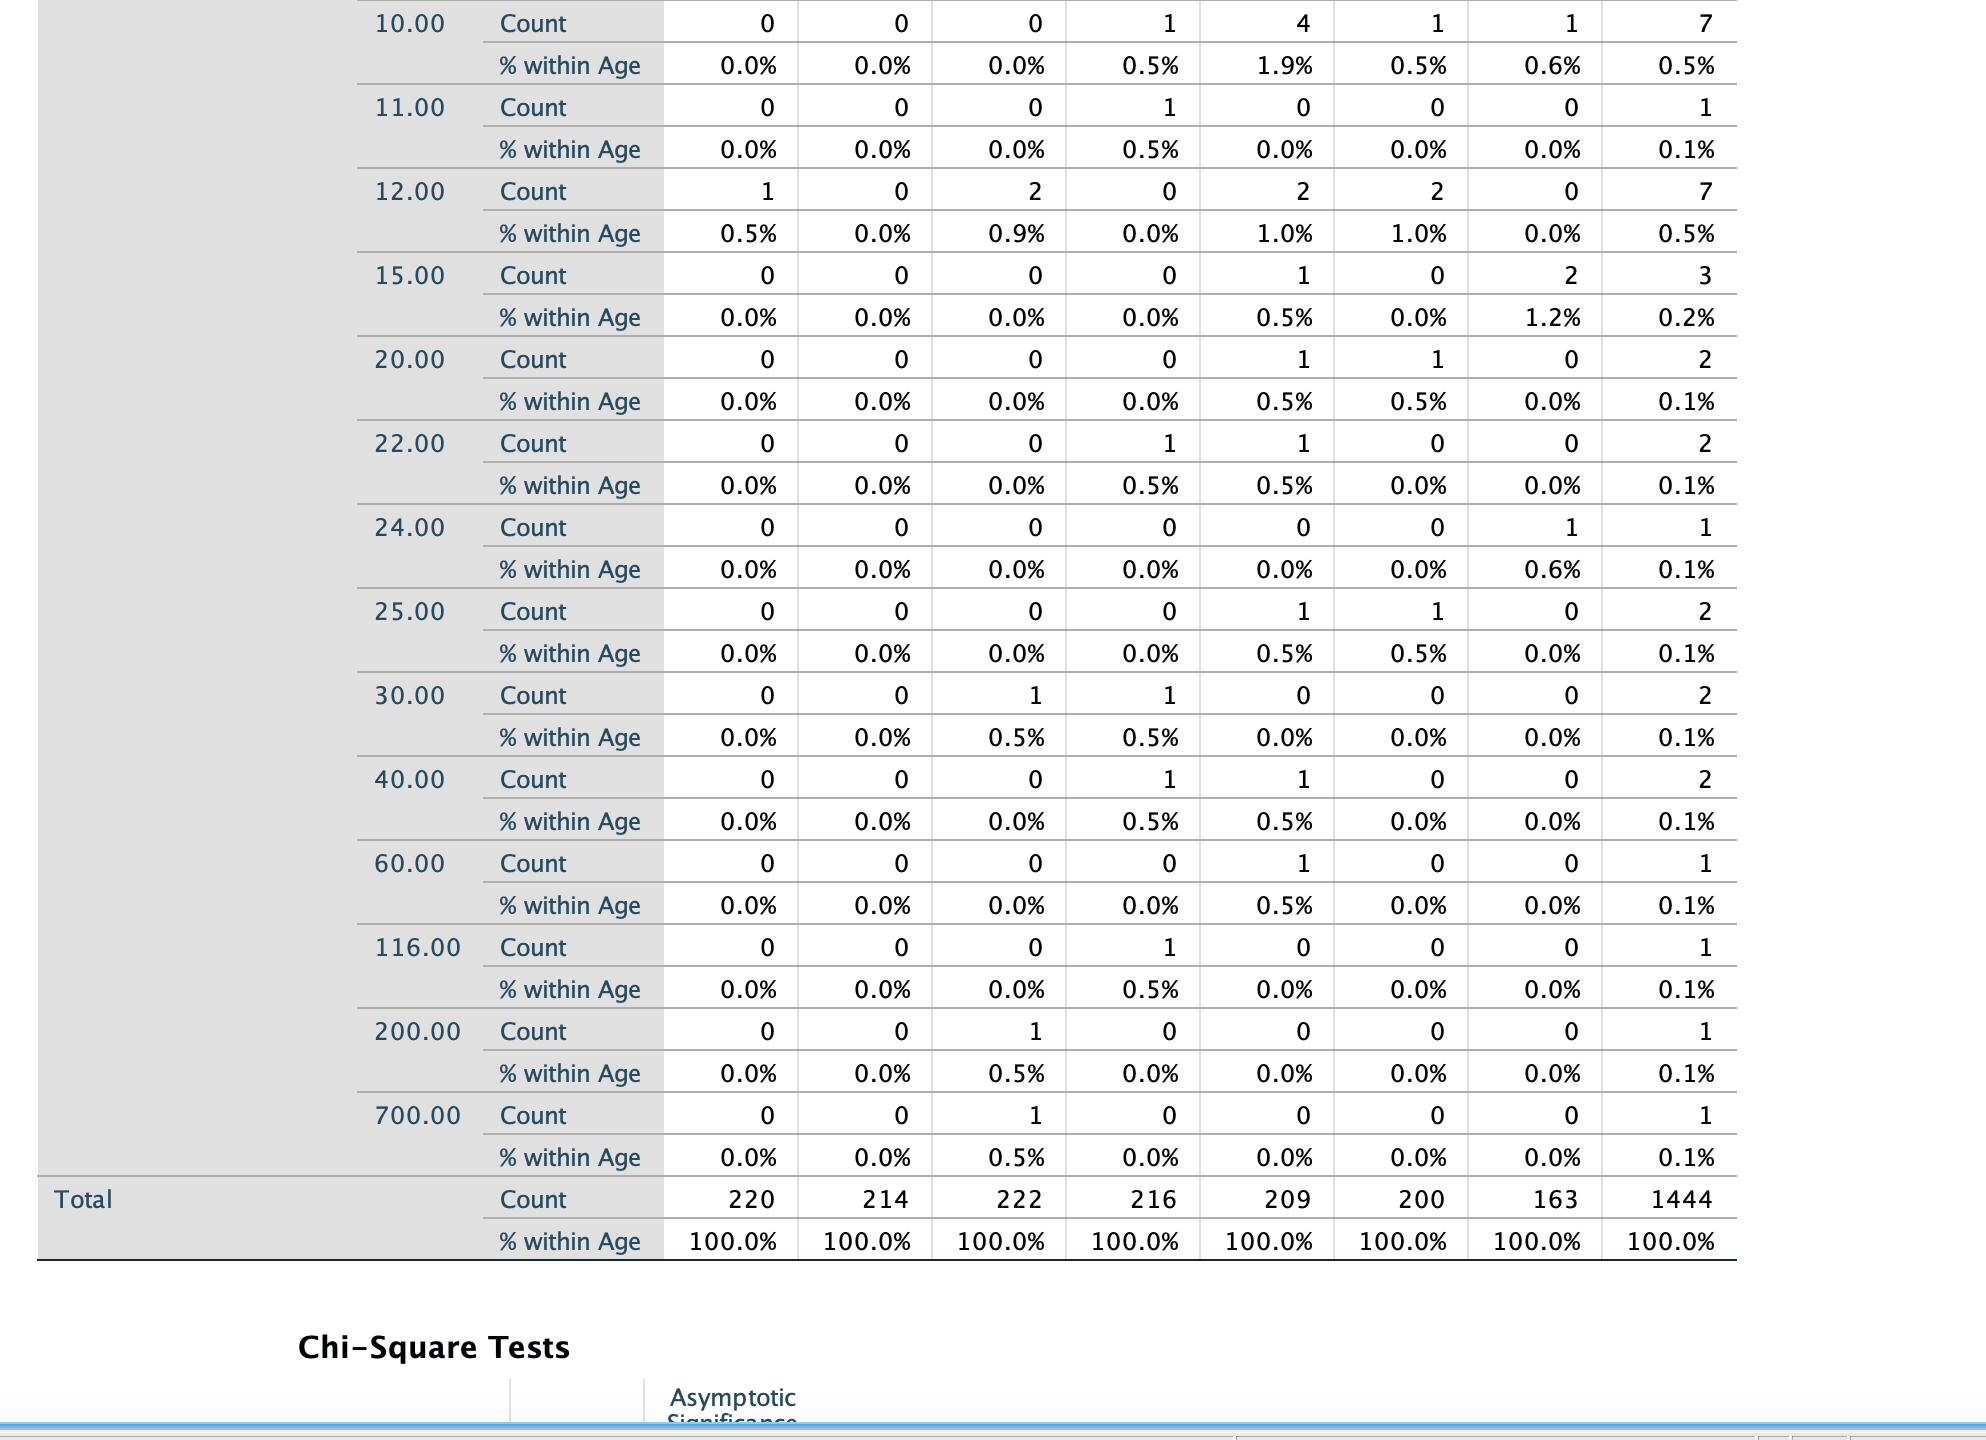
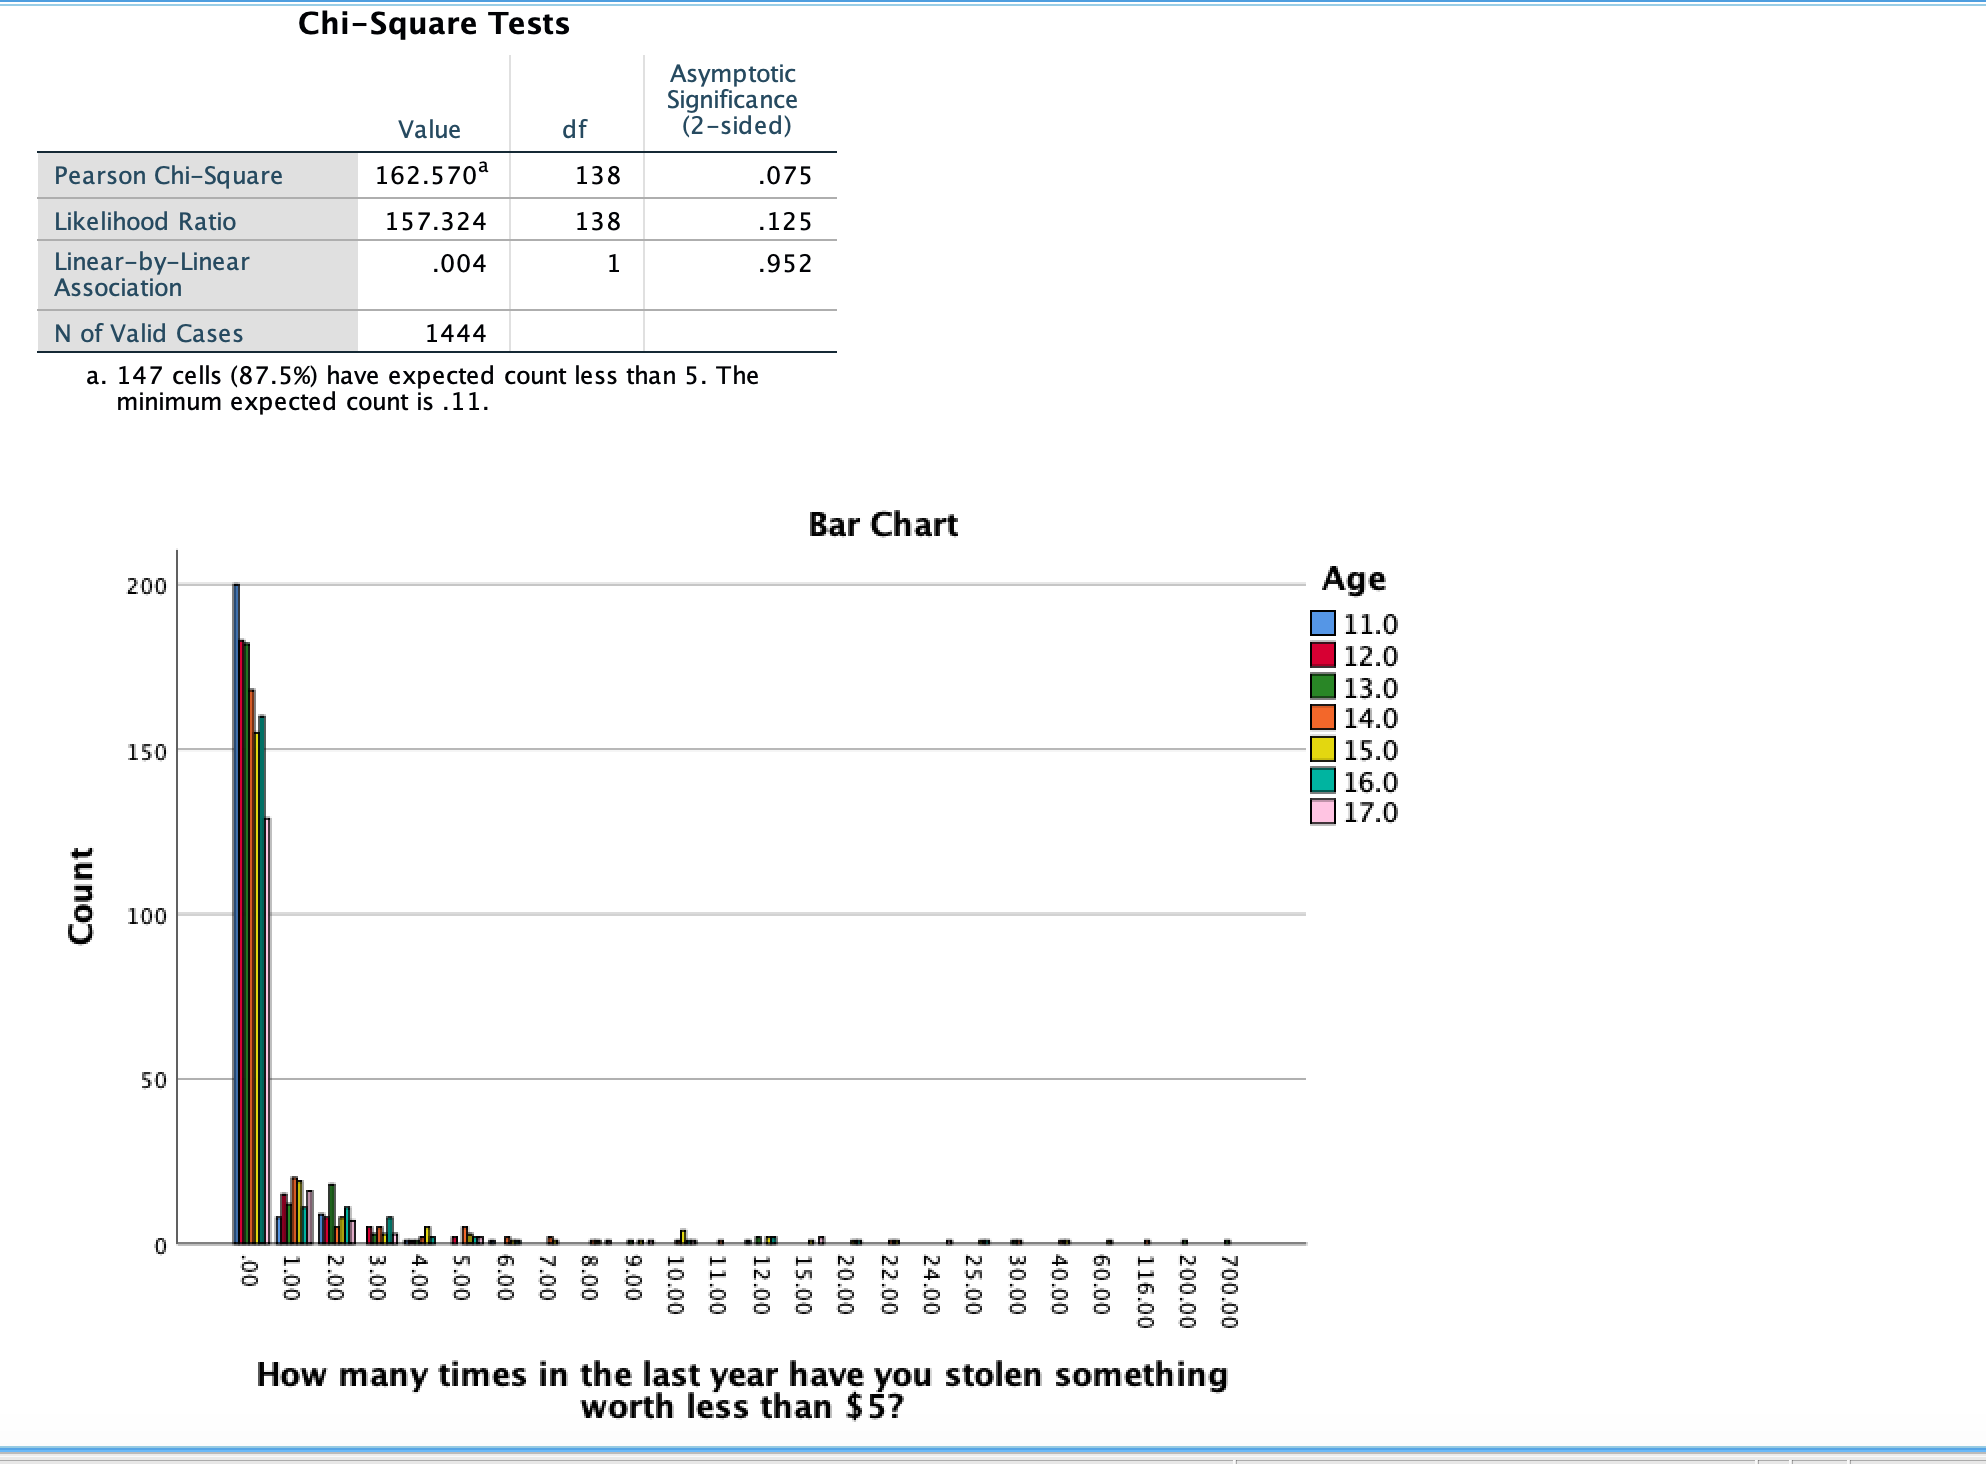
Chi-Square Tests Asymptotic Significance Value df (2-sided) Pearson Chi-Square 355.393a 156 000 Likelihood Ratio 336.060 156 000 Linear-by-Linear 22.069 000 Association N of Valid Cases 1444 a. 168 cells (88.9%) have expected count less than 5. The minimum expected count is .11. Bar Chart 250 Age 11.0 12.0 13.0 200 14.0 15.0 16.0 17.0 Count 150 100 50 0 HNW 150 240 250 How many times in the last year have you been drunk?Case Processing Summary Cases Valid Missing Total N Percent N Percent N Percent How many times in the 1444 99.6% 6 0.4% 1450 100.0% last year have you been drunk? * Age How many times in the last year have you been drunk? * Age Crosstabulation Age 11.0 12.0 13.0 14.0 15.0 16.0 17.0 Total How many times in the 0 Count 219 211 208 192 162 130 104 1226 WERE?\" have V\" bee" % within Age 99.5% 98.6% 93.7% 88.9% 77.5% 65.0% 63.8% 84.9% 1 Count 1 2 7 9 15 10 14 58 % within Age 0.5% 0.9% 3.2% 4.2% 7.2% 5.0% 8.6% 4.0% 2 Count 0 0 4 8 13 19 14 58 % within Age 0.0% 0.0% 1.8% 3.7% 6.2% 9.5% 8.6% 4.0% 3 Count 0 0 2 1 4 7 7 21 % within Age 0.0% 0.0% 0.9% 0.5% 1.9% 3.5% 4.3% 1.5% 4 Count 0 1 0 1 1 2 4 9 % within Age 0.0% 0.5% 0.0% 0.5% 0.5% 1.0% 2.5% 0.6% 5 Count 0 0 0 1 4 7 3 15 % within Age 0.0% 0.0% 0.0% 0.5% 1.9% 3.5% 1.8% 1.0% 6 Count 0 0 0 0 o 4 5 9 % within Age 0.0% 0.0% 0.0% 0.0% 0.0% 2.0% 3.1% 0.6% 7 Count 0 0 1 0 1 2 0 4 % within Age 0.0% 0.0% 0.5% 0.0% 0.5% 1.0% 0.0% 0.3% 8 Count 0 0 0 0 0 0 1 1 % within Age 0.0% 0.0% 0.0% 0.0% 0.0% 0.0% 0.6% 0.1% 10 Count 0 0 0 0 3 5 4 12 % within Age 0.0% 0.0% 0.0% 0.0% 1.4% 2.5% 2.5% 0.8% 12 Count 0 0 0 1 0 2 1 4 % within Age 0.0% 0.0% 0.0% 0.5% 0.0% 1.0% 0.6% 0.3% 15 Count 0 0 0 0 4 1 1 6 15 Count 0 0 0 0 4 1 1 6 % within Age 0.0% 0.0% 0.0% 0.0% 1.9% 0.5% 0.6% 0.4% 16 Count 0 0 % within Age 0.0% 0.0% 0.0% 0.0% 0.0% 0.5% 0.0% 0.1% 20 Count 2 3 % within Age 0.0% 0.0% 0.0% 0.0% 0.5% 0.0% 1.2% 0.2% 24 Count 0 % within Age 0.0% 0.0% 0.0% 0.0% 0.0% 0.5% 0.0% 0.1% 25 Count 0 2 3 % within Age 0.0% 0.0% 0.0% 0.0% 0.0% 1.0% 0.6% 0.2% 26 Count % within Age 0.0% 0.0% 0.0% 0.5% 0.0% 0.0% 0.0% 0. 1% 30 Count 0 0 0 2 0 2 % within Age 0.0% 0.0% 0.0% 0.0% 0.0% 1.0% 0.0% 0.1% 33 Count % within Age 0.0% 0.0% 0.0% 0.0% 0.0% 0.5% 0.0% 0. 1% 37 Count 0 0 0 0 0 1 1 % within Age 0.0% 0.0% 0.0% 0.0% 0.0% 0.0% 0.6% 0.1% 50 Count % within Age 0.0% 0.0% 0.0% 0.0% 0.5% 0.5% 0.0% 0.1% 75 Count 0 0 % within Age 0.0% 0.0% 0.0% 0.5% 0.0% 0.0% 0.0% 0. 1% 104 Count 0 0 % within Age 0.0% 0.0% 0.0% 0.5% 0.0% 0.0% 0.0% 0.1% 116 Count 0 0 % within Age 0.0% 0.0% 0.0% 0.0% 0.0% 0.0% 0.6% 0.1% 150 Count % within Age 0.0% 0.0% 0.0% 0.0% 0.0% 0.5% 0.0% 0. 1% 240 Count % within Age 0.0% 0.0% 0.0% 0.0% 0.0% 0.5% 0.0% 0.1% 250 Count 0 0 % within Age 0.0% 0.0% 0.0% 0.0% 0.0% 0.5% 0.0% 0.1% Total Count 220 214 222 216 209 200 163 1444 % within Age 100.0% 100.0% 100.0% 100.0% 100.0% 100.0% 100.0% 100.0%mary Cases Valid Missing Total N Percent N Percent N Percent How many times in the 1440 99.3% 10 0.7% 1450 100.0% last year have you cheated on an exam at school? * Age How many times in the last year have you cheated on an exam at school? * Age Crosstabulation Age 11.0 12.0 13.0 14.0 15.0 16.0 17.0 Total How many times in the 00 Count 147 last year have you 135 123 96 73 73 78 725 cheated on an exam at % within Age 66.8% 63.1% 55.4% 44.4% 35.1% 37.1% 47.9% 50.3% school? 1.00 Count 39 33 29 34 26 26 20 207 % within Age 17.7% 15.4% 13.1% 15.7% 12.5% 13.2% 12.3% 14.4% 2.00 Count 20 19 34 35 35 35 27 205 % within Age 9.1% 8.9% 15.3% 16.2% 16.8% 17.8% 16.6% 14.2% 3.00 Count 11 10 16 12 71 % within Ag 1.8% 5.1% 4.5% 4.2% 7.7% 6.1% 5.5% 4.9% 4.00 Count 2 3 9 9 6 40 % within Age 0.9% 1.9% 1.4% 4.2% 3.4% 4.6% 3.7% 2.8% 5.00 Count 2 6 8 13 11 8 52 % within Age 1.8% 0.9% 2.7% 3.7% 6.3% 5.6% 4.9% 3.6% 6.00 Count 2 2 2 18 % within Age 0.5% 0.9% 0.9% 0.9% 1.9% 3.0% 0.6% 1.3% 7.00 Count % within Age 0.0% 0.5% 0.5% 0.5% 1.0% 1.0% 0.0% 0.5% 8.00 Count 0 2 % within Age 0.0% 0.0% 0.5% 0.0% 0.0% 0.0% 0.6% 0.1% 9.00 Count 8 % within Age 0.0% 0.0% 1.8% 0.9% 0.0% 1.0% 0.0% 0.6% 10.00 Count 1 10 3 24 % within Age 0.5% 0.5% 0.5% 1.9% 4.8% 2.0% 1.8% 1.7% 11.00 Count 011.00 Count 0 0 0 0 0 1 0 1 % within Age 0.0% 0.0% 0.0% 0.0% 0.0% 0.5% 0.0% 0. 1% 12.00 Count 0 3 2 3 10 % within Age 0.0% 0.0% 0.5% 1.4% 1.0% 1.5% 0.6% 0.7% 13.00 Count 2 % within Age 0.0% 0.0% 0.5% 0.0% 0.0% 0.0% 0.6% 0.1% 14.00 Count % within Age 0.0% 0.0% 0.0% 0.0% 0.5% 0.0% 0.0% 0. 1% 15.00 Count 0 1 2 2 2 15 % within Age 0.0% 0.5% 0.5% 0.9% 3.4% 1.0% 1.2% 1.0% 20.00 Count 3 2 10 % within Age 0.0% 1.4% 0.5% 0.9% 1.0% 0.5% 0.6% 0.7% 22.00 Count 0 0 0 0 0 2 % within Age 0.0% 0.0% 0.0% 0.0% 0.5% 0.5% 0.0% 0.1% 23.00 Count % within Age 0.0% 0.0% 0.0% 0.0% 0.5% 0.0% 0.0% 0. 1% 24.00 Count 0 0 % within Age 0.0% 0.0% 0.0% 0.0% 0.0% 0.0% 0.6% 0. 1% 25.00 Count 0 0 % within Age 0.0% 0.0% 0.0% 0.0% 0.5% 0.0% 0.0% 0.1% 26.00 Count 0 0 0 % within Age 0.0% 0.0% 0.0% 0.5% 0.0% 0.0% 0.0% 0.1% 30.00 Count 3 8 % within Age 0.0% 0.0% 0.5% 1.4% 1.0% 1.0% 0.0% 0.6% 33.00 Count % within Age 0.0% 0.0% 0.0% 0.0% 0.0% 0.0% 0.6% 0. 1% 35.00 Count 3 % within Age 0.5% 0.0% 0.0% 0.0% 0.5% 0.0% 0.6% 0.2% 36.00 Count 2 % within Age 0.0% 0.0% 0.0% 0.5% 0.0% 0.5% 0.0% 0.1% 40.00 Count 0 0 3 0 5 % within Age 0.5% 0.0% 0.5% 0.0% 0.0% 1.5% 0.0% 0.3% 48.00 Count % within Age 0.0% 0.0% 0.0% 0.5% 0.0% 0.0% 0.0% 0. 1%48.00 Count 0 0 % within Age 0.0% 0.0% 0.0% 0.5% 0.0% 0.0% 0.0% 0. 1% 50.00 Count 6 % within Age 0.0% 0.5% 0.0% 0.5% 1.0% 0.5% 0.6% 0.4% 52.00 Count 3 % within Age 0.0% 0.5% 0.0% 0.5% 0.5% 0.0% 0.0% 0.2% 70.00 Count % within Age 0.0% 0.0% 0.0% 0.0% 0.0% 0.5% 0.0% 0.1% 71.00 Count % within Age 0.0% 0.0% 0.5% 0.0% 0.0% 0.0% 0.0% 0.1% 72.00 Count 0 0 0 0 % within Age 0.0% 0.0% 0.0% 0.0% 0.0% 0.0% 0.6% 0.1% 100.00 Count % within Age 0.0% 0.0% 0.0% 0.0% 0.0% 0.5% 0.0% 0. 1% 116.00 Count 0 0 0 0 0 0 1 % within Age 0.0% 0.0% 0.0% 0.0% 0.5% 0.0% 0.0% 0. 1% 119.00 Count 0 % within Age 0.0% 0.0% 0.0% 0.5% 0.0% 0.0% 0.0% 0.1% 200.00 Count 0 0 0 % within Age 0.0% 0.0% 0.5% 0.0% 0.0% 0.0% 0.0% 0. 1% Total Count 220 214 222 216 80 197 163 1440 % within Age 100.0% 100.0% 100.0% 100.0% 100.0% 100.0% 100.0% 100.0% Chi-Square Tests Asymptotic Significance Value df (2-sided) Pearson Chi-Square 298.880a 216 000 Likelihood Ratio 274.835 216 .004 Linear-by-Linear 15.702 1 .000 Association N of Valid Cases 1440 a. 218 cells (84.2%) have expected count less than 5. The minimum expected count is .11.Age 11.0 12.0 13.0 14.0 15.0 0'9T 0'ZI 200.00 116.00 72.00 170.00 $50.00 Bar Chart 40.00 35.00 $ 30.00 25.00 23.00 20.00 14.00 12.00 10.00 8.00 6.00 4.00 2.00 How many times in the last year have you cheated on an exam at school? 150 DOT 50 0 CountCase Processing Summary Cases Valid Missing Total N Percent N Percent N Percent How many times in the 1444 99.6% 6 0.4% 1450 100.0% last year have you stolen something worth less than $5? * Age How many times in the last year have you stolen something worth less than $5? * Age Crosstabulation Age 11.0 12.0 13.0 14.0 15.0 16.0 17.0 Total How many times in the .00 last year have you Count 200 183 182 168 155 160 129 1177 stolen something worth % within Age 90.9% 85.5% 82.0% 77.8% 74.2% 80.0% 79.1% 81.5% less than $5? 1.00 Count 8 15 12 20 19 11 16 101 % within Age 3.6% 7.0% 5.4% 9.3% 9.1% 5.5% 9.8% 7.0% 2.00 Count 18 5 8 11 66 % within Age 4.1% 3.7% 8.1% 2.3% 3.8% 5.5% 4.3% 4.6% 3.00 Count 0 5 3 5 3 8 3 27 % within Age 0.0% 2.3% 1.4% 2.3% 1.4% 4.0% 1.8% 1.9% 4.00 Count 5 12 % within Age 0.5% 0.5% 0.5% 0.9% 2.4% 1.0% 0.0% 0.8% 5.00 Count 2 0 5 3 2 2 14 % within Age 0.0% 0.9% 0.0% 2.3% 1.4% 1.0% 1.2% 1.0% 6.00 Count 5 % within Age 0.5% 0.0% 0.0% 0.9% 0.5% 0.5% 0.0% 0.3% 7.00 Count 3 % within Age 0.0% 0.0% 0.0% 0.9% 0.5% 0.0% 0.0% 0.2% 8.00 Count 0 0 1 1 0 1 3 % within Age 0.0% 0.0% 0.0% 0.5% 0.5% 0.0% 0.6% 0.2% 9.00 Count 0 3 % within Age 0.0% 0.0% 0.5% 0.0% 0.5% 0.0% 0.6% 0.2% 10.00 Count 0 1 4 1 710.00 Count 0 0 0 1 4 1 1 7 % within Age 0.0% 0.0% 0.0% 0.5% 1.9% 0.5% 0.6% 0.5% 11.00 Count 0 0 0 1 % within Age 0.0% 0.0% 0.0% 0.5% 0.0% 0.0% 0.0% 0. 1% 12.00 Count 1 2 0 2 2 0 7 % within Age 0.5% 0.0% 0.9% 0.0% 1.0% 1.0% 0.0% 0.5% 15.00 Count 2 3 % within Age 0.0% 0.0% 0.0% 0.0% 0.5% 0.0% 1.2% 0.2% 20.00 Count 2 % within Age 0.0% 0.0% 0.0% 0.0% 0.5% 0.5% 0.0% 0.1% 22.00 Count 0 0 1 0 0 2 % within Age 0.0% 0.0% 0.0% 0.5% 0.5% 0.0% 0.0% 0.1% 24.00 Count 0 % within Age 0.0% 0.0% 0.0% 0.0% 0.0% 0.0% 0.6% 0. 1% 25.00 Count 0 0 0 2 % within Age 0.0% 0.0% 0.0% 0.0% 0.5% 0.5% 0.0% 0.1% 30.00 Count 2 % within Age 0.0% 0.0% 0.5% 0.5% 0.0% 0.0% 0.0% 0. 1% 40.00 Count 2 % within Age 0.0% 0.0% 0.0% 0.5% 0.5% 0.0% 0.0% 0. 1% 60.00 Count 0 0 0 1 0 0 1 % within Age 0.0% 0.0% 0.0% 0.0% 0.5% 0.0% 0.0% 0. 1% 116.00 Count 0 1 % within Age 0.0% 0.0% 0.0% 0.5% 0.0% 0.0% 0.0% 0. 1% 200.00 Count 0 0 0 0 1 % within Age 0.0% 0.0% 0.5% 0.0% 0.0% 0.0% 0.0% 0.1% 700.00 Count % within Age 0.0% 0.0% 0.5% 0.0% 0.0% 0.0% 0.0% 0.1% Total Count 220 214 222 216 209 20 163 1444 % within Age 100.0% 100.0% 100.0% 100.0% 100.0% 100.0% 100.0% 100.0% Chi-Square Tests Asymptotic CimnificentChi-Square Tests Asymptotic Significance Value df (2-sided) Pearson Chi-Square 162.570a 075 Likelihood Ratio 157.324 138 125 Linear-by-Linear .004 952 Association N of Valid Cases 1444 a. 147 cells (87.5%) have expected count less than 5. The minimum expected count is . 11. Bar Chart 200 Age 11.0 12.0 13.0 14.0 150 15.0 16.0 17.0 Count 100 50 00'0 OO'T 0O'ST 00'0 124.00 25.00 00'OE 00'09 00'9TT 200.00 00'004 How many times in the last year have you stolen something worth less than $5
