Answered step by step
Verified Expert Solution
Question
1 Approved Answer
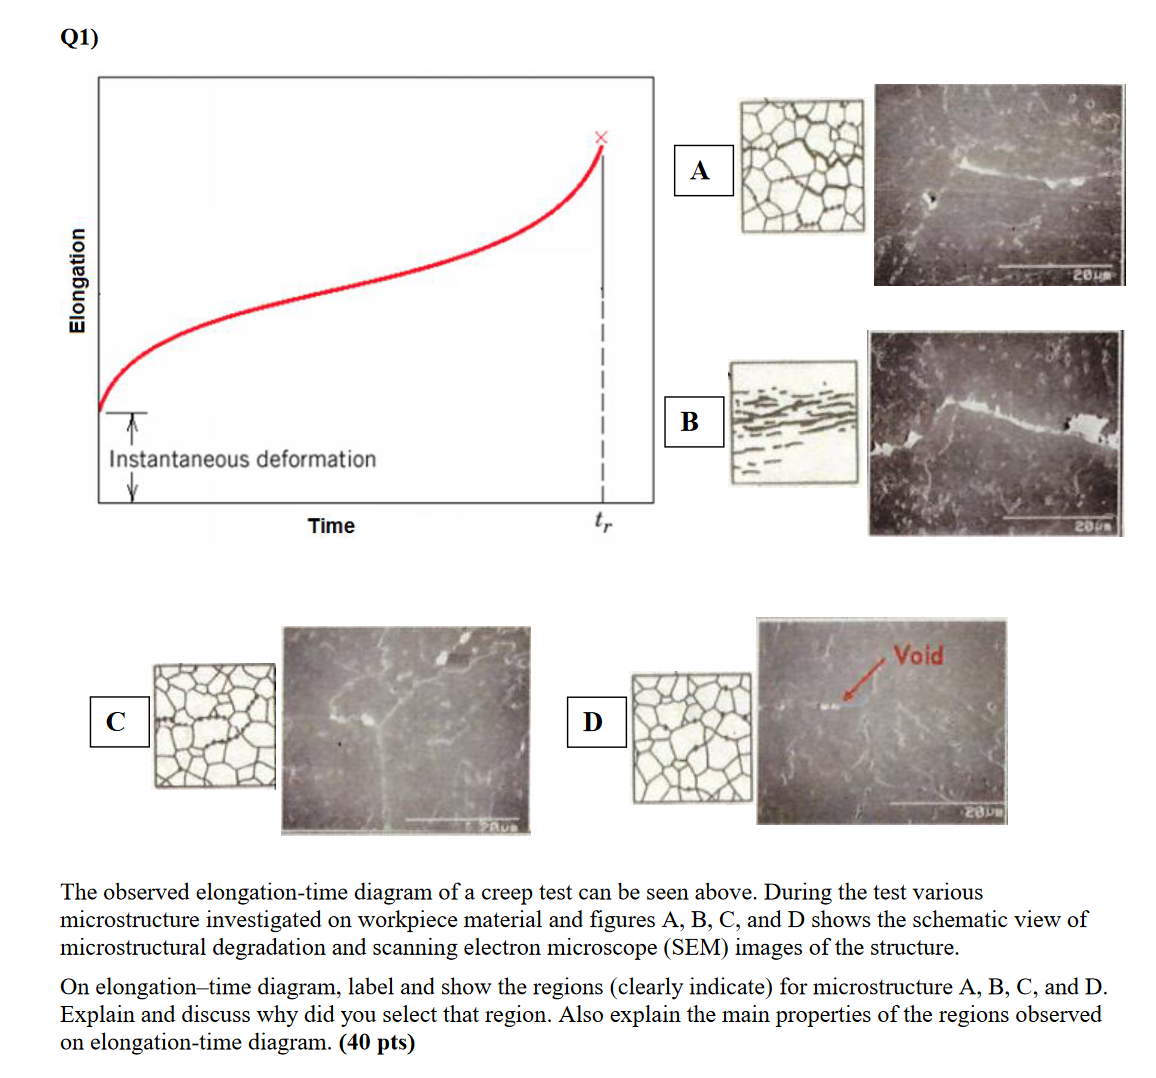
The observed elongation - time diagram of a creep test can be seen above. During the test various microstructure investigated on workpiece material and figures
The observed elongationtime diagram of a creep test can be seen above. During the test various
microstructure investigated on workpiece material and figures A B C and D shows the schematic view of
microstructural degradation and scanning electron microscope SEM images of the structure.
On elongationtime diagram, label and show the regions clearly indicate for microstructure A B C and D
Explain and discuss why did you select that region. Also explain the main properties of the regions observed
on elongationtime diagram. pts

Step by Step Solution
There are 3 Steps involved in it
Step: 1

Get Instant Access to Expert-Tailored Solutions
See step-by-step solutions with expert insights and AI powered tools for academic success
Step: 2

Step: 3

Ace Your Homework with AI
Get the answers you need in no time with our AI-driven, step-by-step assistance
Get Started


