

Answered step by step
Verified Expert Solution
Question
1 Approved Answer
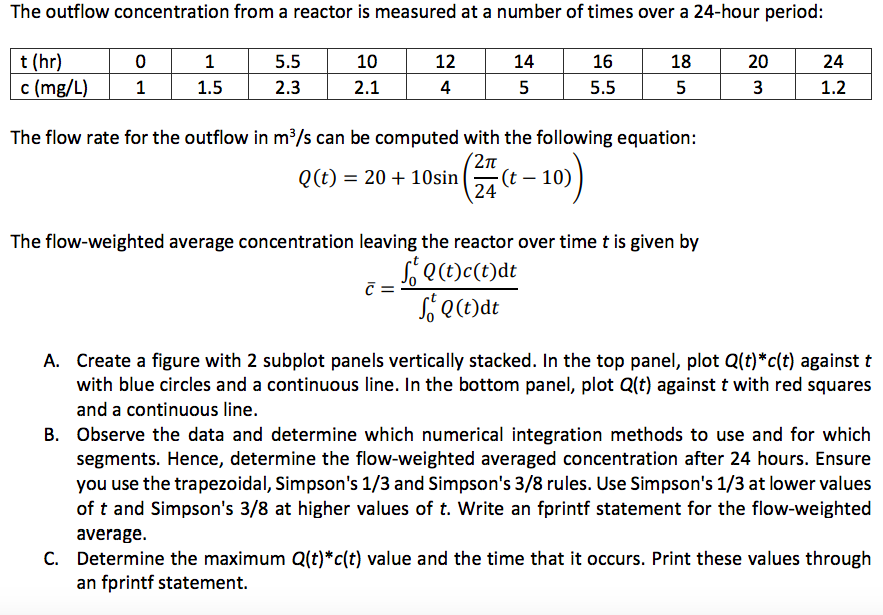
The outflow concentration from a reactor is measured at a number of times over a 24-hour period t (hr) c (mg/L) 11.52.32.1 14 5 16
Step by Step Solution
There are 3 Steps involved in it
Step: 1

Get Instant Access to Expert-Tailored Solutions
See step-by-step solutions with expert insights and AI powered tools for academic success
Step: 2

Step: 3
Ace Your Homework with AI
Get the answers you need in no time with our AI-driven, step-by-step assistance
Get Started
Database Systems Design Implementation And Management
Authors: Peter Robb,Carlos Coronel
5th Edition
061906269X, 9780619062699