Answered step by step
Verified Expert Solution
Question
1 Approved Answer
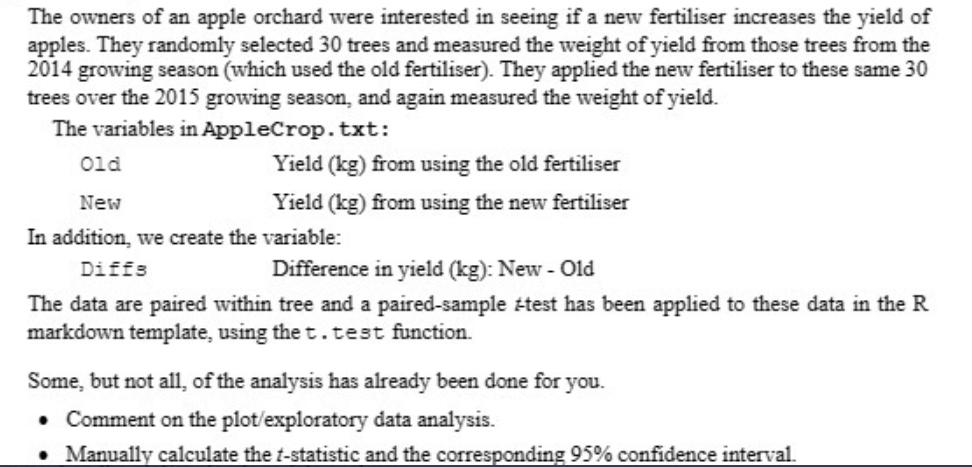
The owners of an apple orchard were interested in seeing if a new fertiliser increases the yield of apples. They randomly selected 30 trees

The owners of an apple orchard were interested in seeing if a new fertiliser increases the yield of apples. They randomly selected 30 trees and measured the weight of yield from those trees from the 2014 growing season (which used the old fertiliser). They applied the new fertiliser to these same 30 trees over the 2015 growing season, and again measured the weight of yield. The variables in AppleCrop.txt: Yield (kg) from using the old fertiliser Yield (kg) from using the new fertiliser Old New In addition, we create the variable: Diffs Difference in yield (kg): New - Old The data are paired within tree and a paired-sample +test has been applied to these data in the R markdown template, using the t.test function. Some, but not all, of the analysis has already been done for you. Comment on the plot/exploratory data analysis. Manually calculate the t-statistic and the corresponding 95% confidence interval.
Step by Step Solution
There are 3 Steps involved in it
Step: 1
As the data is paired and we are interested in comparing the yields from the old and new fertilizers a scatter plot of the paired data is appropriate ...
Get Instant Access to Expert-Tailored Solutions
See step-by-step solutions with expert insights and AI powered tools for academic success
Step: 2

Step: 3

Ace Your Homework with AI
Get the answers you need in no time with our AI-driven, step-by-step assistance
Get Started


