Question
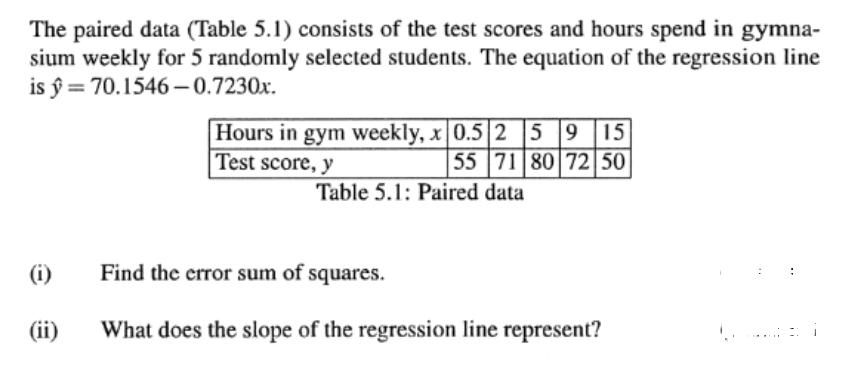
The paired data (Table 5.1) consists of the test scores and hours spend in gymna- sium weekly for 5 randomly selected students. The equation

The paired data (Table 5.1) consists of the test scores and hours spend in gymna- sium weekly for 5 randomly selected students. The equation of the regression line is = 70.1546-0.7230x. (i) (ii) Hours in gym weekly, x 0.5 2 5 9 15 Test score, y 55 71 80 72 50 Table 5.1: Paired data Find the error sum of squares. What does the slope of the regression line represent?
Step by Step Solution
3.32 Rating (149 Votes )
There are 3 Steps involved in it
Step: 1
b i X y 05 55 697931 687086 2 71 701546 07230x 9 7015...
Get Instant Access to Expert-Tailored Solutions
See step-by-step solutions with expert insights and AI powered tools for academic success
Step: 2

Step: 3

Ace Your Homework with AI
Get the answers you need in no time with our AI-driven, step-by-step assistance
Get StartedRecommended Textbook for
Elementary Statistics
Authors: Robert R. Johnson, Patricia J. Kuby
11th Edition
978-053873350, 9781133169321, 538733500, 1133169325, 978-0538733502
Students also viewed these Accounting questions
Question
Answered: 1 week ago
Question
Answered: 1 week ago
Question
Answered: 1 week ago
Question
Answered: 1 week ago
Question
Answered: 1 week ago
Question
Answered: 1 week ago
Question
Answered: 1 week ago
Question
Answered: 1 week ago
Question
Answered: 1 week ago
Question
Answered: 1 week ago
Question
Answered: 1 week ago
Question
Answered: 1 week ago
Question
Answered: 1 week ago
Question
Answered: 1 week ago
Question
Answered: 1 week ago
Question
Answered: 1 week ago
Question
Answered: 1 week ago
Question
Answered: 1 week ago
Question
Answered: 1 week ago
Question
Answered: 1 week ago
Question
Answered: 1 week ago
Question
Answered: 1 week ago
Question
Answered: 1 week ago
View Answer in SolutionInn App


