Question
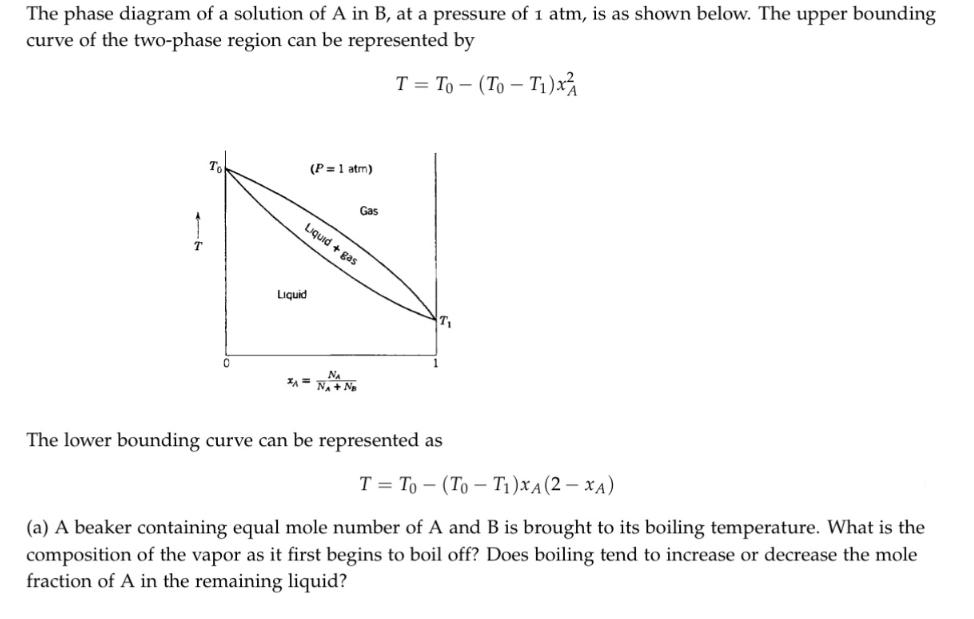
The phase diagram of a solution of A in B, at a pressure of 1 atm, is as shown below. The upper bounding curve

The phase diagram of a solution of A in B, at a pressure of 1 atm, is as shown below. The upper bounding curve of the two-phase region can be represented by T = To - (To-T)x 1 0 Liquid (P= 1 atm) Gas Liquid + gas The lower bounding curve can be represented as T= To (To-T)XA (2-XA) (a) A beaker containing equal mole number of A and B is brought to its boiling temperature. What is the composition of the vapor as it first begins to boil off? Does boiling tend to increase or decrease the mole fraction of A in the remaining liquid?
Step by Step Solution
There are 3 Steps involved in it
Step: 1

Get Instant Access to Expert-Tailored Solutions
See step-by-step solutions with expert insights and AI powered tools for academic success
Step: 2

Step: 3

Ace Your Homework with AI
Get the answers you need in no time with our AI-driven, step-by-step assistance
Get StartedRecommended Textbook for
Chemistry The Central Science
Authors: Theodore Brown, Eugene LeMay, Bruce Bursten, Catherine Murphy, Patrick Woodward
12th edition
321696727, 978-0132175081, 978-0321696724
Students also viewed these Chemical Engineering questions
Question
Answered: 1 week ago
Question
Answered: 1 week ago
Question
Answered: 1 week ago
Question
Answered: 1 week ago
Question
Answered: 1 week ago
Question
Answered: 1 week ago
Question
Answered: 1 week ago
Question
Answered: 1 week ago
Question
Answered: 1 week ago
Question
Answered: 1 week ago
Question
Answered: 1 week ago
Question
Answered: 1 week ago
Question
Answered: 1 week ago
Question
Answered: 1 week ago
Question
Answered: 1 week ago
Question
Answered: 1 week ago
Question
Answered: 1 week ago
Question
Answered: 1 week ago
Question
Answered: 1 week ago
Question
Answered: 1 week ago
Question
Answered: 1 week ago
View Answer in SolutionInn App


