

Answered step by step
Verified Expert Solution
Question
1 Approved Answer
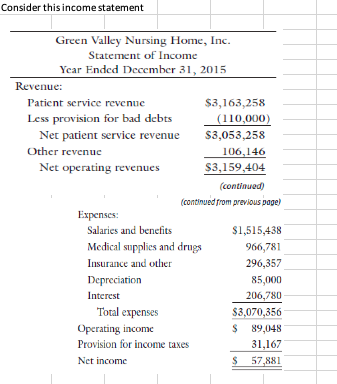
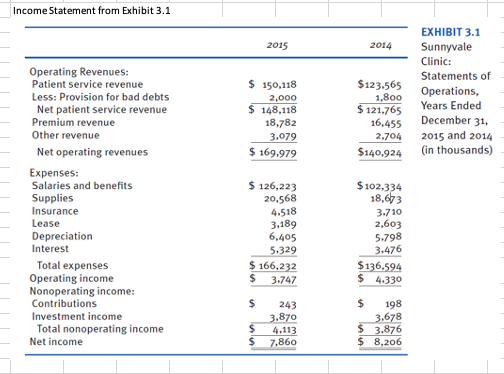
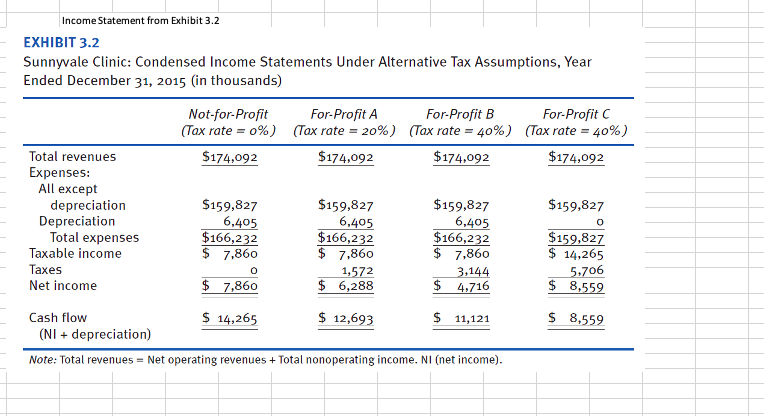
The photo below are the requirements and questions needed to be answered.The photos are what go with these questions A. How does the income statement
The photo below are the requirements and questions needed to be answered.The photos are what go with these questions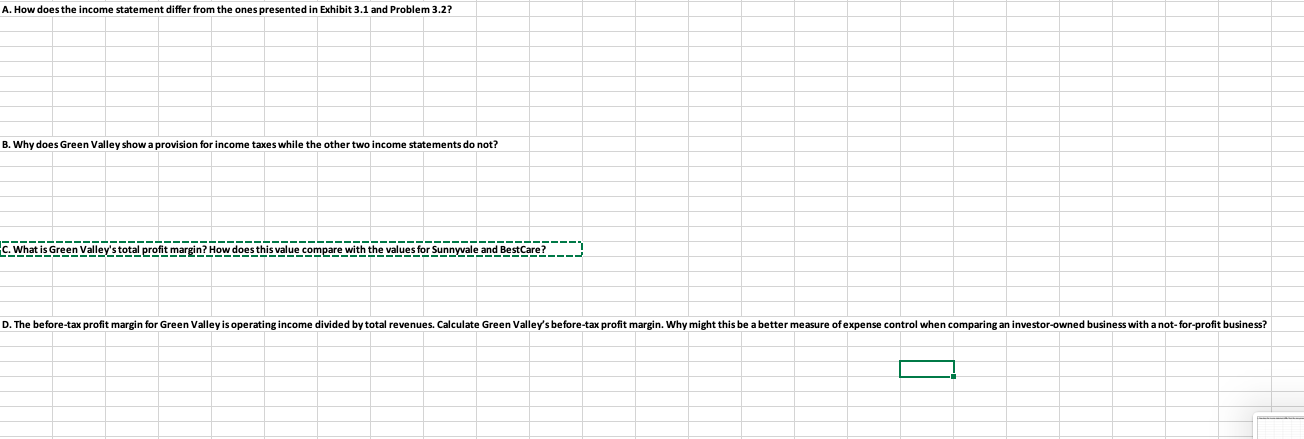
Step by Step Solution
There are 3 Steps involved in it
Step: 1

Get Instant Access to Expert-Tailored Solutions
See step-by-step solutions with expert insights and AI powered tools for academic success
Step: 2

Step: 3
Ace Your Homework with AI
Get the answers you need in no time with our AI-driven, step-by-step assistance
Get Started
Technology And Finance Challenges For Financial Markets Business Strategies And Policy Makers
Authors: Morten Balling, Frank Lierman, Andy Mullineux
1st Edition
041529827X, 978-0415298278