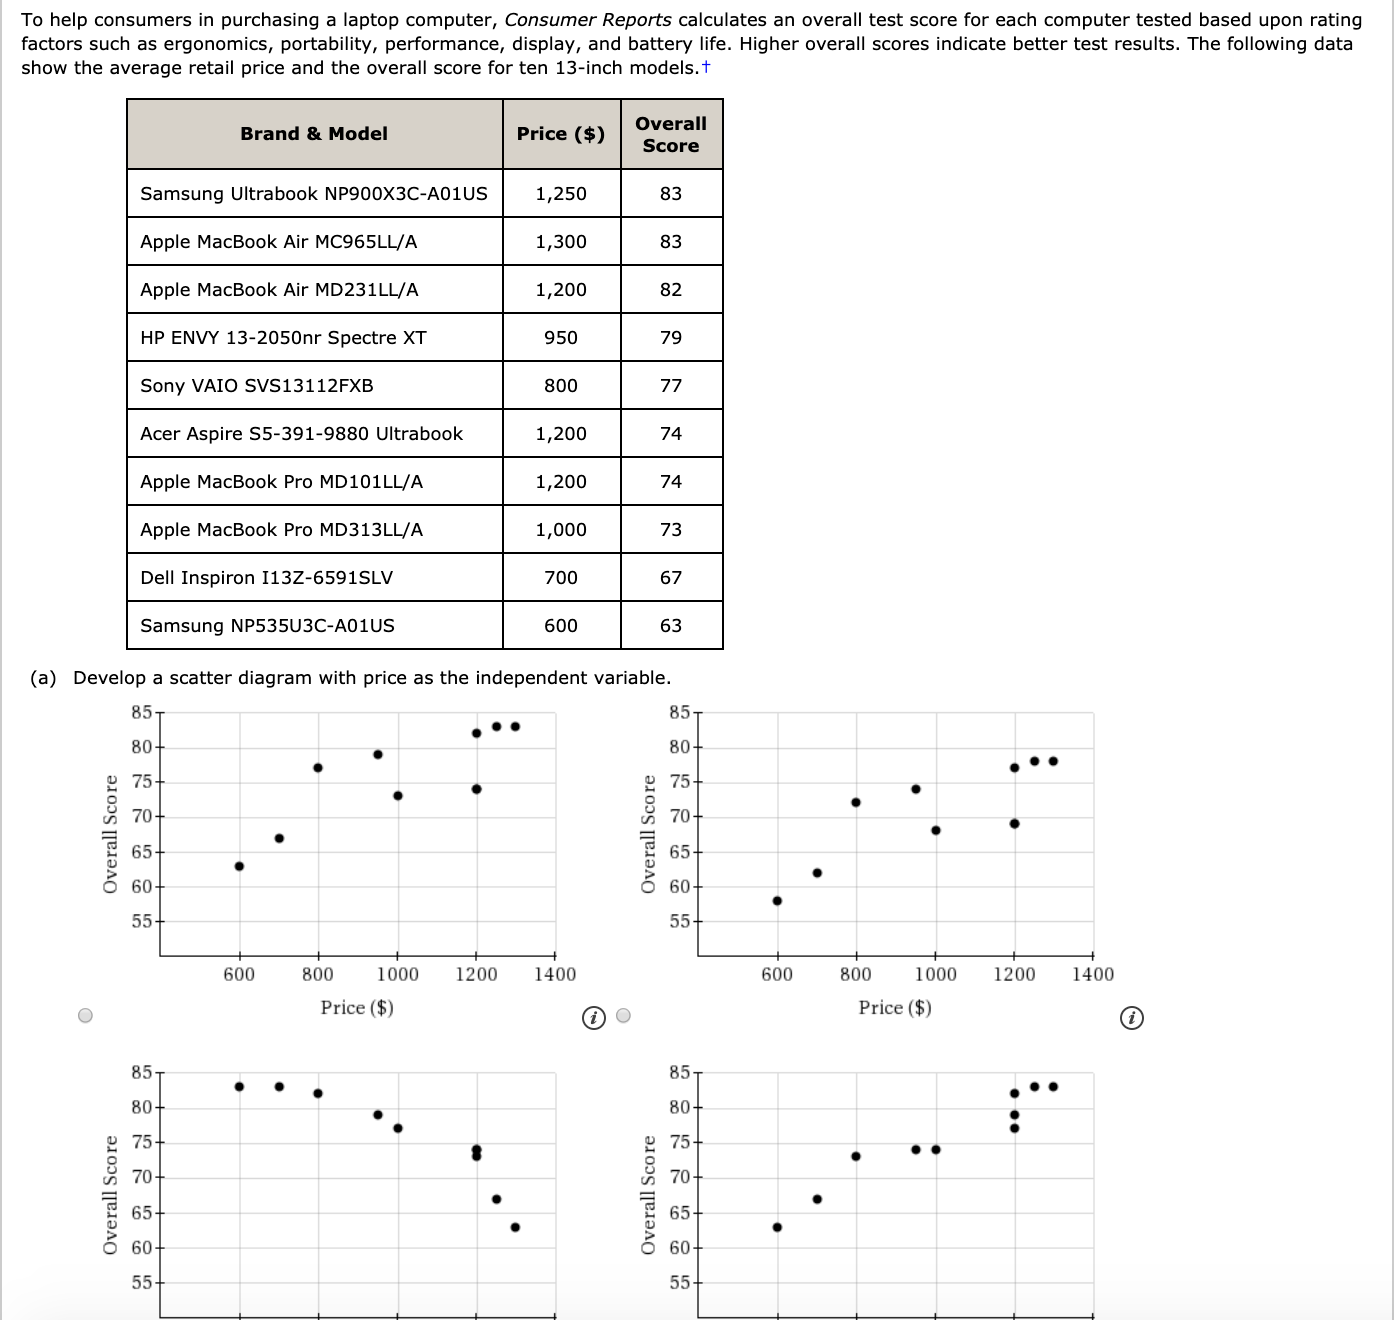
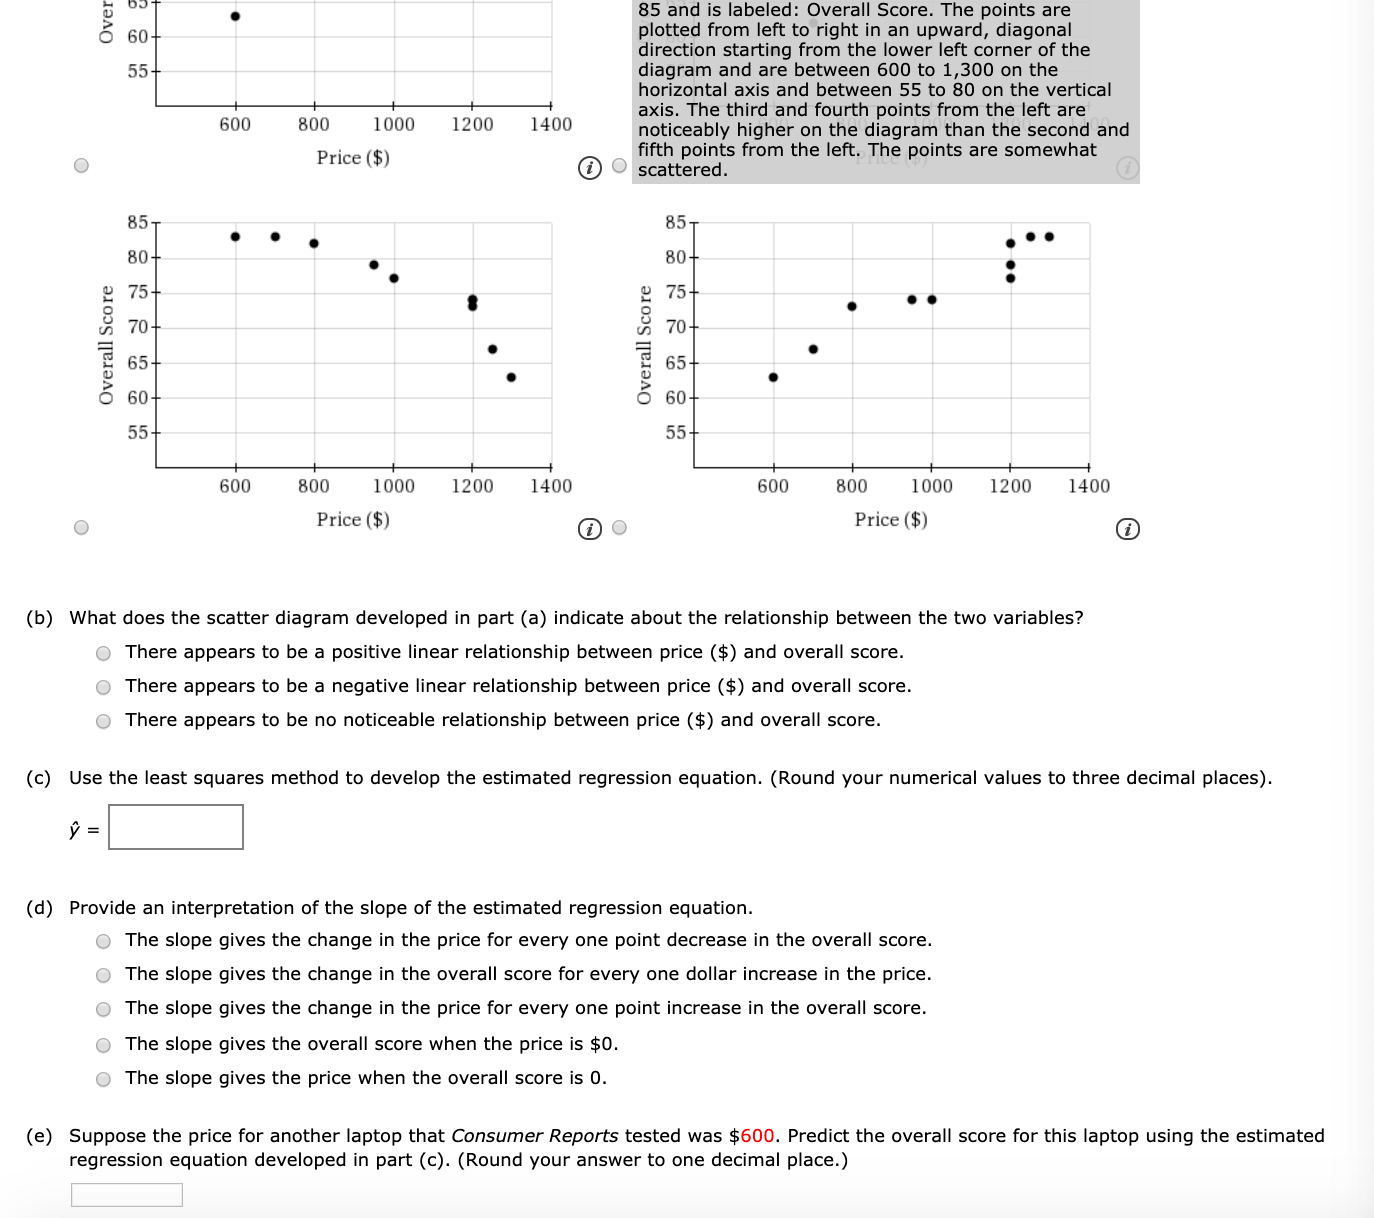
the photo uploaded reverse. First question on bottom photo. Can you help?
To help consumers in purchasing a laptop computer, Consumer Reports calculates an overall test score for each computer tested based upon rating factors such as ergonomics, portability, performance, display, and battery life. Higher overall scores indicate better test results. The following data show the average retail price and the overall score for ten 13-inch models.'r m- Score -n -n m- mn (a) Develop a scatter diagram with price as the independent variable. 85 85 80 80 g 75 g 75 O 0 c3 70 :3 70 :5 55 E 65 O 60 O 60 55 55 600 500 1000 1200 1400 600 500 1000 1200 1400 0 Price (5) (D 0 Price (5) (D E E 8 8 U) (I) a a D O :a :a O O Over 85 and is labeled: Overall Score. The points are 60 plotted from left to right in an upward, diagonal direction starting from the lower left corner of the 55 diagram and are between 600 to 1,300 on the horizontal axis and between 55 to 80 on the vertical 600 800 1000 1200 1400 axis. The third and fourth points from the left are noticeably higher on the diagram than the second and Price ($) 1scattered. fifth points from the left. The points are somewhat 85 85- 80- 80- Overall Score 75- 70- Overall Score 75- 70- 65 65- 60- 60- 55- 55- 600 800 1000 1200 1400 600 800 1000 1200 1400 O Price ($) Price ($) i (b) What does the scatter diagram developed in part (a) indicate about the relationship between the two variables? O There appears to be a positive linear relationship between price ($) and overall score. O There appears to be a negative linear relationship between price ($) and overall score. O There appears to be no noticeable relationship between price ($) and overall score. (c) Use the least squares method to develop the estimated regression equation. (Round your numerical values to three decimal places). (d) Provide an interpretation of the slope of the estimated regression equation. O The slope gives the change in the price for every one point decrease in the overall score. The slope gives the change in the overall score for every one dollar increase in the price. The slope gives the change in the price for every one point increase in the overall score. The slope gives the overall score when the price is $0. O The slope gives the price when the overall score is 0. (e) Suppose the price for another laptop that Consumer Reports tested was $600. Predict the overall score for this laptop using the estimated regression equation developed in part (c). (Round your answer to one decimal place.)