

Question
The picture is a Spreadsheet with Sales Data for 20 Weeks. First Develop a 3 Week Moving Average Forecast and then calculate the Mean Absolute
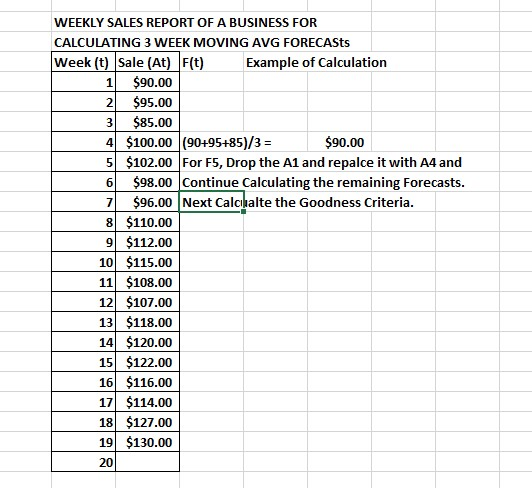
The picture is a Spreadsheet with Sales Data for 20 Weeks. First Develop a 3 Week Moving Average Forecast and then calculate the Mean Absolute Deviation (MAD). Your Calculated MAD is =
a. 4.65 b. 7.44 c. 3.72 d. 8.73 e. 3.91
WEEKLY SALES REPORT OF A BUSINESS FOR CALCULATING 3 WEEK MOVING AVG FORECAStsStep by Step Solution
There are 3 Steps involved in it
Step: 1

Get Instant Access to Expert-Tailored Solutions
See step-by-step solutions with expert insights and AI powered tools for academic success
Step: 2

Step: 3
Ace Your Homework with AI
Get the answers you need in no time with our AI-driven, step-by-step assistance
Get Started
The Fundamentals Of Fashion Management
Authors: Susan Dillon
2nd Edition
1474271219, 978-1474271219